

Investor Education Series: Return on Equity (ROE)
When you invest in a company by buying shares of their stock, you are purchasing an ownership stake. The KEY reason why you do so is because you expect the company’s business to do well which ultimately translates to a higher share price.
All companies, if given UNLIMITED monetary resources, will be able to turn in a profit at some point in their business cycle. However, the aim is to find companies who are given LIMITED resources and yet can find ways to grow their business and generate profits for themselves.
In this article, we will be exploring 1. What is ROE? 2. How do you calculate ROE? 3 What is a good ROE ratio? 4 Which are the factors that could “artificially” impact ROE? 5. What are the variations of ROE? 6. A list of S&P500 companies with strong ROE ratios and 7. A brief look at the ROE valuation method in deriving a “fair value” for a counter.
What is ROE or Return on Equity?
One of the most important profitability metrics for investors, and a Warren Buffett’s favorite, is the company’s return on equity or ROE for short. To put it in layman’s term, ROE conveys the percentage of investor dollars (how much a shareholder has contributed in terms of equity) that have been converted into income (or profit). This provides a sense of how efficient the company is in handling their monetary resources.
A company with a higher return on equity (roe) is more efficient in terms of generating profits from new capital injection, all else equal.
Stocks that often outperform in the long run are those that are capable of consistently generating a high return on equity (roe). These are often seen as highly capital efficient stocks and once you found a company that exhibits such characteristics, you should then try to acquire its shares at the “right” price.
For example, if a company has an ROE ratio of 20%, this will mean that for every $1 of stockholders’ equity, the company is generating $0.20 in net profit.
How do you calculate the return on equity (ROE)?
Return on equity is calculated using the following simple formula:
Return on Equity = Net Profit (fiscal year) / Shareholders’ Equity
Example:
- John sets up Company ABC which generates $200k in its very first year
- He is the sole owner of Company ABC with 100,000 shares at a cost of $10/share
- Total Shareholders’ equity = 100,000 shares * $10/share = $1,000,000
- Year 1 ROE = 200,000 / 1,000,000 = 20%
This means that every dollar of shareholders’ equity generated $0.20 in profits.
Before we further elaborate on our example, it is important to define a couple of terms.
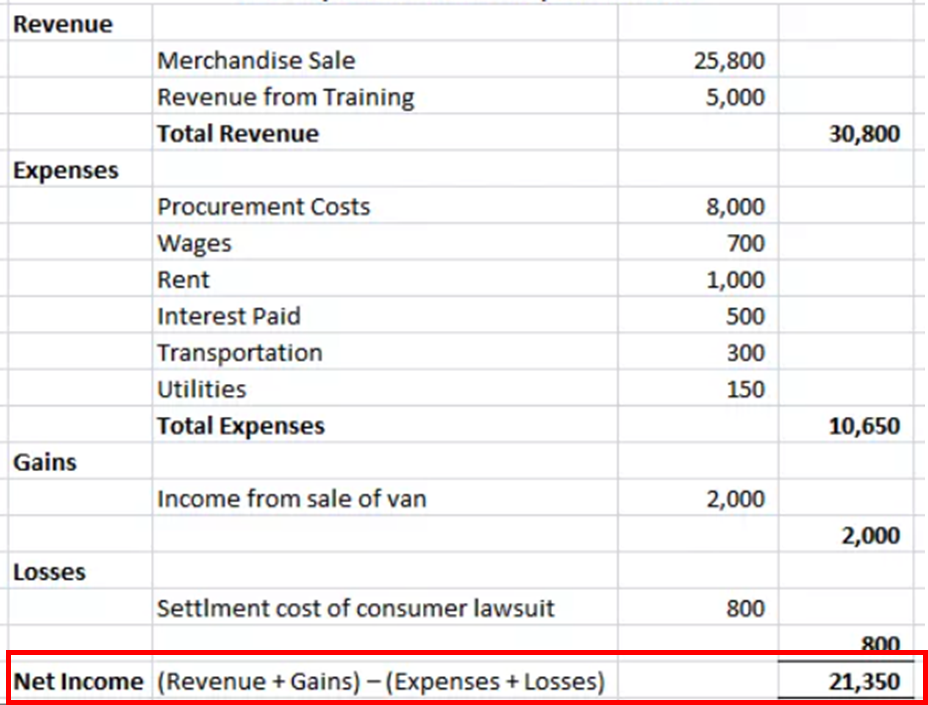
Net Profit is determined by subtracting total expenses from total revenues. This is the key financial/profitability metric that most investors are concern about when they invest in a company. Is the company profitable on the bottom line?
The net profit figure is found on a company’s income statement.
Sample P&L Statement
Shareholders’ equity is calculated by subtracting the Total Liabilities from Total Assets. This figure can be found on a company’s balance sheet.
Sample Balance Sheet Statement
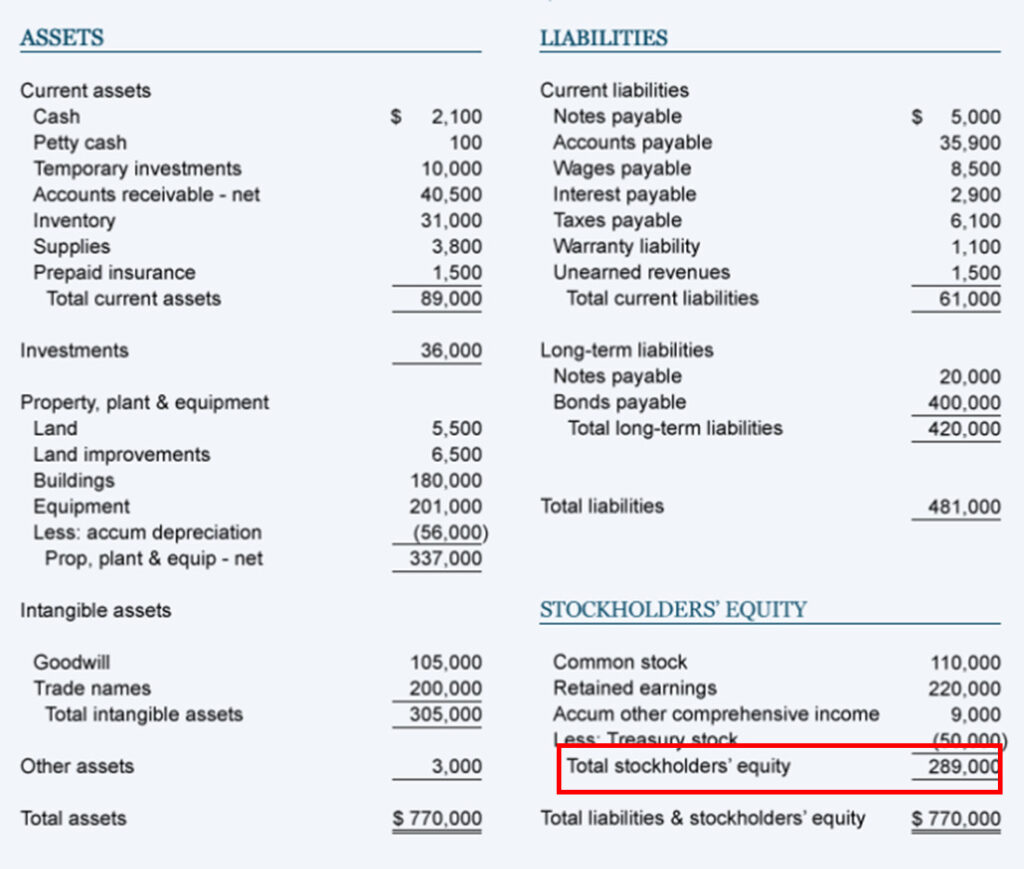
So ROE is a figure that combines the usage of both the income statement as well as the balance sheet of a company.
So in our above example, if John had injected $500,000 as shareholders’ equity (100,000 shares at $5/share) instead of the original $1,000,000 while yet still generate $200,000 in profits for his first year, his ROE would be 200,000 / 500,000 = 40%.
His $500,000 “seed” capital is now more efficient in generating the same profit amount vs. when he had to put $1,000,000.
So, going back to the same example, what happens when Company ABC generates the same profitability level of $200,000 in its 2nd Year? What is the Company’s ROE now?
Assuming that John did not “extract” any capital out of Company ABC in the form of dividends, the total shareholders’ equity = $1,000,000 (original amount) + $200,000 (1st year profit) = $1,200,000
ROE for 2nd Year = $200,000 / $1,200,000 = 16.7%
The ROE drops from 20% to 16.7% despite Company ABC generating the same level of profits in its 2nd Year. This is because there is now additional “capital” in the company which should translate to a higher profit level. Hence if Company ABC’s profitability remains the same in Year 2 vs. Year 1, the company is now less efficient in translating that capital amount into new profits.
What is a good ROE figure?
Generally, a company that can achieve a consistent ROE figure of between 15-20% is considered GOOD. However, there is no one figure fits all solutions and when comparing the ROE of a company, it is best to compare it to its peer groups.
For example, if you would to compare a Consumer Staple stock like Coca-Cola (KO) which has an ROE of close to 40% vs. a new start-up fintech company that might not yet be profitable such as Sea Ltd (SE), then the conclusion made based on ROE alone will be erroneous. One will conclude that KO is a far-superior company compared to SE based on the ROE figure alone which does not necessarily paint a correct representation of the situation.
Instead, one should compare KO’s ROE vs a similar peer such as Pepsi (PEP) to see if the former’s ROE is indeed superior. In this case, PEP has an equally high if not higher ROE of 50%.
When might the ROE be “artificially” high or low?
As mentioned, an ROE figure of 15-20% is generally considered good and a company that can consistently generate ROE above 20% is extremely efficient in managing its capital. There are cases where good companies such as McDonald’s (MCD), Philip Morris (PM), etc are witnessing extremely high ROE or even negative ROE? What is going on?
Share Buyback
ROE can be “artificially” inflated due to a company’s share buy-back policy which reduces the company’s Shareholders Equity amount. The more the company buys back its shares, the lower the shareholder equity amount will become.
Since the company’s net profit is not impacted by the number of outstanding shares (we are not referring to EPS in this case), the same net profit is now divided by a smaller “Shareholders’ Equity” amount, thus translating to a higher ROE.
In the case of MCD and PM, they have been using excess capital to buy back their shares for decades. This translates to “negative” shareholder equity and thus result in negative ROE. In such a scenario, it will be erroneous to say that MCD and PM are inefficient managers of their capital. It is quite the opposite.
It is ideal if a company uses its excess capital to buy-back shares. It is an indirect way of returning excess capital to shareholders (instead of a direct manner by paying dividends). However, it might become problematic when the company uses new borrowings to fund that share repurchase.
This is what happens to many US airline companies that had to be bailed out due to COVID-19. Instead of “saving for a rainy day”, they “levered-up” to fund billions of share buybacks over the past decade which made their share price looks attractive (EPS is now higher due to lower outstanding shares). That all came tumbling down due to COVID-19 but their managers have already “reap the rewards” of such debt-driven share repurchases over the past 10-years.
Who can blame them when the cost of borrowings is so low? It is indeed another form of capital management, one which has an element of “peer pressure”, particularly when every other airline is leveraging up to buy back their shares.
If ROE is too low relative to the average, it may mean that the company is underperforming. This could be a case where they are conservatively run and not making full use of the assets available to them to grow. Alternatively, if the ROE metric is low due to higher-than-average shareholder equity amount (vs. profit level) it could also mean that excess capital can be returned to shareholders.
Asset writedown
Another way in which ROE can be artificially inflated is due to asset write-down. When a company write-down its assets (which likely is over-valued on its balance sheet), the shareholders’ equity will also be almost equally impacted.
For example, if the company’s key equipment is only worth $50 but is valued at $100 in its book, the company will need to “write-down” this asset value to $50. This will mean that its Profit and Loss will be hit by a one-off -$50 figure which will affect its reported Net Profit. Consequently, shareholders’ equity will be reduced by a corresponding -$50 due to the write-off.
However, this is a one-off event and the street might look to “normalize” its profit by excluding this -$50 impact. The “adjusted” net profit will not reflect the write-down amount while the shareholder equity figure is usually not being adjusted, therefore reflecting a higher ROE figure.
In the second year, this write-off will not recur and if the company can maintain its income, the ROE will become higher.
Variations of ROE
Because ROE is something that’s left for an investor to figure out for themselves, many savvy investors have created different ways to tweak the formula to get a more meaningful result.
- Return on Common Equity (ROCE)is a variation of ROE that only takes into account the equity held by common shareholders (excludes preferred shares). The formula for ROCE is:
ROCE = (Net income – preferred dividends)/common equity
- Using average shareholder equity– in some cases, investors may want to take the average of shareholders’ equity at the beginning of a period and the end. This is simply done by adding the two numbers together and dividing by two.
- Averaging ROE over five to 10 years – ROE is typically a one-year measurement. So, to give yourself a better idea of a company’s growth from a historical perspective, it may be helpful to calculate ROE over a long period to see trends
- Using Return on Invested Capital or (ROIC) which takes into account the usage of debt in generating profits. In its simplest form (I exclude dividends):
ROIC = Net income / (Shareholders’ Equity + Total Debt)
We will be talking about ROIC in the future investor educational series.
Companies with strong ROE ratios
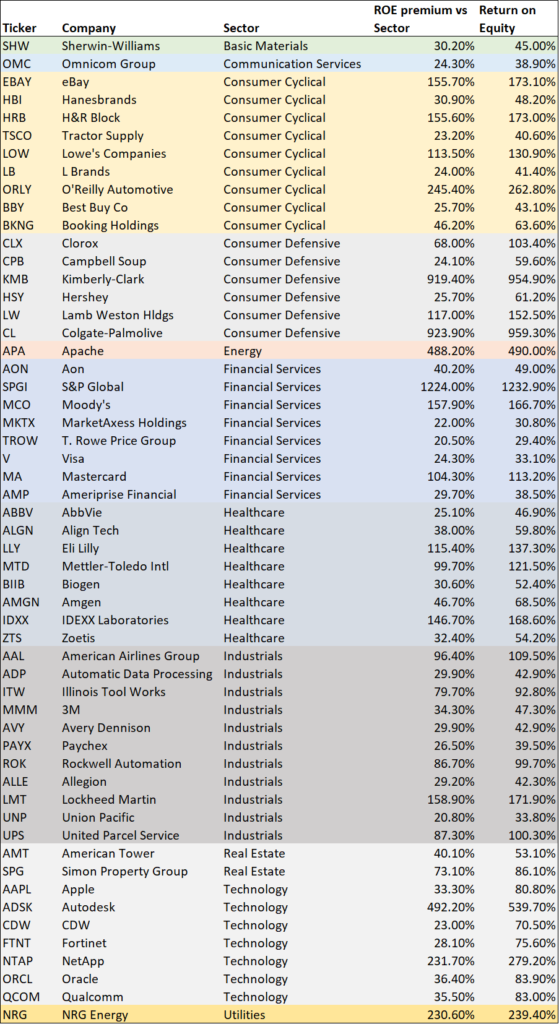
The table below showcase a list of S&P500 companies
- With strong ROE ratios (>=20%)
- ROE premium vs. Sector (>= 20%)
For Point 2, take for example a company with an ROE of 30%. If the sector’s average ROE is 10%, this will mean that the company has an ROE premium of (30% -10%) = 20%. This will make sure that we are not just selecting companies with high ROEs, but also one where their ROEs are high relative to their sector peers.
ROE Valuation in deriving Fair Value
One of Warren Buffett’s favorite financial metric is buying companies that exhibit a high ROE ratio. However, it should not be done on a standalone basis. More importantly, the high ROE ratio has to be sustainable and one which is preferably accompanied by a predictable earnings pattern.
Hence, companies with predictable earnings growth coupled with a high ROE figure is what Buffett likes to see when it comes to evaluating their financial health. Of course, there are a lot more metrics when it comes to evaluating the company’s “business health” which is likely a topic for another article.
ROE valuation
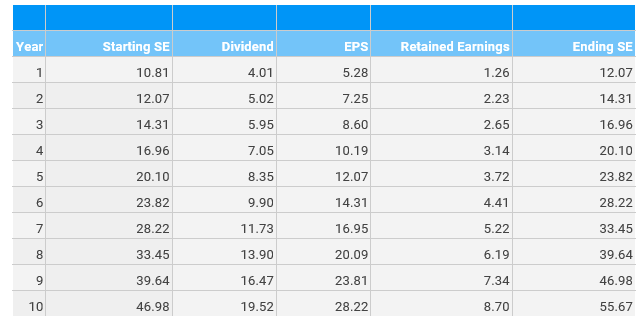
The above table provides a “flavour” as to how I evaluate a company using the ROE valuation. However, I will not be going into details in this article.
Key assumptions:
- Average ROE of 60%
- Average dividend payout ratio of 70%
- EPS (from Year 2 onwards) calculated as 60% * Starting Shareholder Equity
We can use the ROE valuation method to calculate what might a company’s EPS be like over a 10-year horizon. This is based on the key assumption that the company’s ROE ratio is likely to be stable (in this case 60% over the horizon of 10-years), hence
EPS = ROE * Shareholders’ Equity/Share
We can then “guess” that the company will generate an EPS of $28.22/share on Year 10. Based on an average PER multiple assigned, we can derive a “fair value” by multiplying the company’s Year 10 EPS by the PER multiple.
For example, if the average PER multiple is 15x:
Fair Value = 15 X 28.22 = $423.3
However, this “fair value” will be what the company is worth 10 years down the road. To get the current “fair value” as of today, we discount it back using a discount rate (I use 7% which is the long-term stock market inflation-adjusted return).
We will be discussing more on the ROE valuation method in future investor education articles.
The bottom line on ROE
Return on equity measures how efficiently a firm uses shareholder money to generate profits and grow the business.
While there is no fixed answer to what a good return on equity is, it is generally assumed that a high return on equity is better than a low return on equity. This is because a higher ROE suggests that the company is using shareholders’ money efficiently to generate profits.
However, ROE only provides a snapshot of a company’s potential profitability. Every industry has different expectations for profit and that’s why many investors need to look at a variety of competing companies within an industry to see what an average ROE is supposed to look like. If investors try to compare two companies in different industries, ROE will become a far less significant measurement.
As investors become more familiar with the variables behind ROE, they can choose to adjust the formula as needed to get the data that they feel is most important. For example, they can choose to calculate ROE at both the beginning of a period and the end of that period to see if the ROE has changed, and to what extent. This can give them a clue as to if and how fast a company is growing and its ability to maintain that trend.
Alternatively, they can also choose to use the ROIC ratio which takes into account the usage of debt in generating profits.
Last but not least, one can also use the “ROE” method in deriving a potential fair value of a stock.
Do Like Me on Facebook if you enjoy reading the various investment and personal finance articles at New Academy of Finance. I do post interesting articles on FB from time to time which might not be covered here in this website.
SEE OUR OTHER STOCKS WRITE-UP
- Thematic ETFs partaking in the hottest trends
- Too late to buy Gold? How to play it with Options for >100% annualized ROI
- Philip Morris: How to put its 6% yield on steroids
- How to hedge stocks: 5 levels of hedging
- Dividend Investing Strategy: Combining key ratios with economic moats
- Dividend Yield Theory – the Underappreciated Valuation Tool


