
We all envision to retire with a steady stream of passive income. A carefully planned dividend investing strategy could be your major source of passive income. A newbie dividend investor might just “reach” for the highest yield while a seasoned dividend investor will know better than to fall for these “dividend traps”.
I previously wrote this article: 7 Golden Rules of Dividend Investing which provides a framework for a dividend investing strategy.
In this article, I will provide further elaboration on this dividend investing concept by going through 8 key financial ratios and combining them with the identification of economic moats to develop a successful dividend investing strategy. I will also show you a quick hack to get Morningstar research report on stocks where they tend to identify the presence of economic moat in a stock (No moat, narrow moat, wide moat).
Dividend Growth Investing
A popular dividend investing strategy is Dividend Growth Investing or DGI for short. Such a strategy focuses on stocks that have a good track record of growing its dividend vs. a focus on high yielding dividend stocks. For those interested to get a detailed spreadsheet of US dividend growth stocks, do check the link from Dripinvesting.
DGI Example
Let me give you an example on why a DGI strategy might be superior to a high yielding stock strategy.

Let say there are two investors, John and David. John goes for a high yielding stock (Stock A), one that consistently pays an 8% yield. He reinvests the dividends every year by buying new shares at a fixed price of $100/share. At the end of 30 years, his dividends would have grown to $7,454 and he would have collected total dividends of $90,627.
For David, he purchases Stock B that yields 2% at the beginning but this stock has shown a good track record of growing its dividends steadily by 10% each year. Similarly, to John, he reinvested the dividends every year by buying new shares at a fixed price of $100/share. At the end of 30 years, his dividends would have grown to $50,200 and he would have collected total dividends of $198,400 for the past 30-years.
David’s yield, assuming that the share price remains at $100/share equates to a hefty 32%. We are assuming that the share price remains constant which is highly unlikely for a counter that is growing its DPS by 10% every year, which is most possibly driven by strong earnings per share (EPS) generation. Assuming that Stock B continues to yield 2% on Year 30, what will its share price be?
Answer: $25,100/share and David’s portfolio would be in excess of $2.5m (without reinvesting dividends)
That is why DGI remains one of the most popular dividend investing strategy.
The scope of this article is however about identifying good dividend stocks through the usage of key financial ratios/metrics as well as combining these ratios with economic moat assessment.
Let us now explore some of these key ratios critical for dividend investing.
Dividend Investing Strategy Key Ratio #1: Dividend Payout
The dividend payout ratio is one of the more important ratios that a dividend investor should be aware of. The dividend payout ratio measures how much of a company’s earnings are paid out as a dividend.
The calculation of a company’s dividend payout ratio is quite simple:
Payout ratio = Dividends paid / Earnings Generated (over the same period of time)
For example, McDonald’s latest quarterly dividend per share amounts to USD$1.25. The company is forecasted to pay a full-year dividend of USD$5/share in 2020. With earnings of USD$8.48 forecasted for 2020, the company’s payout ratio is USD$5/USD8.48 = 59%
Investors like to analyze the dividend payout ratio because it can inform how safe a company’s dividend is and how much room it has for future growth.
A dividend payout ratio below 60% is typically very sustainable. However, there are occasions where one can also invest in companies with higher payout ratios (in excess of 70%), particularly if their businesses tend to be very stable such as utility companies.
A dividend payout ratio significantly above 70% might be a risk in terms of dividend sustainability. The company is paying out the bulk of its earnings as dividends, leaving little for reinvesting into growth. If the company’s business is negatively impacted by changing trends, there might not be enough profits to sustain dividend payments ahead.
A good dividend company that fits the low payout ratio profile is McCormick & Company, a dividend aristocrat (a company that has increased its dividend payments for 25 consecutive years or more. More on that in the next segment).
The company has boosted its dividends by 34 straight years. With a dividend payout ratio of only 40%, the company has plenty of “excess bandwidth” to continue its dividend growth trajectory.
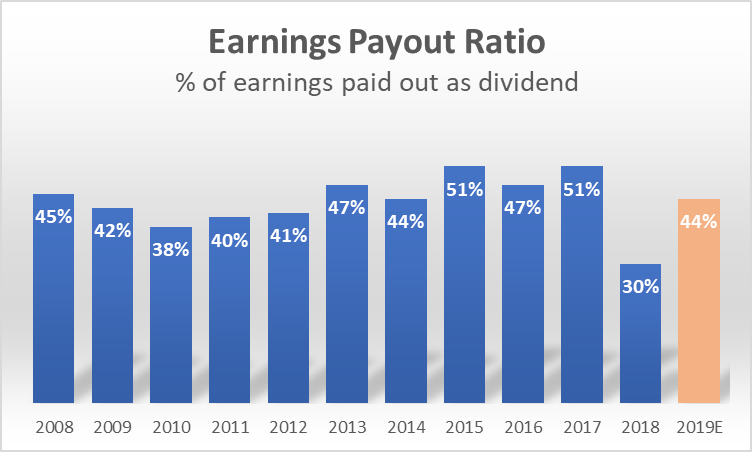
The company’s relatively flat payout ratio means that its dividend growth has been sustainably fuelled by growth in its earnings.
Dividend Investing Strategy Key Ratio #2: Dividend Growth
Dividend growth ranks highly as one of the top criteria for any dividend investors. Currently, there are 64 Dividend Aristocrats in the S&P 500. All these companies have improved the amount of their total annual dividend payments every year for at least 25 years (and in many cases, they have done it for much longer).
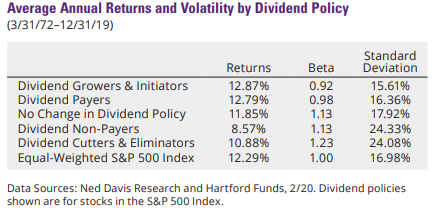
According to data from Ned Davis Research and Hartford funds, based on stocks within the S&P 500 index, stocks that exhibit dividend growth profiles generated the best performing returns from 1972-2019.
Not only that, but these returns were also achieved with lower beta and standard deviation.
Corporations that consistently grow their dividends have historically exhibited strong fundamentals, solid business plans, and a deep commitment to their shareholders. Consistent dividend growth is only achievable with a corresponding consistency in terms of earnings and free cash flow growth, resulting in a build-up of cash on a corporate balance sheet.
This excess cash should allow businesses with existing dividends to maintain, if not grow, their dividends.
With interest rates expected to remain low in the foreseeable future, this means dividend-paying stocks should continue to offer attractive yields relative to many fixed-income asset classes.
Dividend Investing Strategy Key Ratio #3: Free Cash Flow
Free cash flow is the lifeline of any business.
Free cash flow is simply operating cash inflow minus operating cash outflow minus the cash outflow for capital acquisitions such as equipment or vehicle. This financial metric is calculated using the company’s statement of cash flows.
Free cash flow = Cash flow from operations – Capital expenditure
If a company does not generate free cash flow, it will not have excess funds to return to shareholders by either dividend payments or share repurchases. Nor does it have the flexibility to acquire new businesses using its cash-on-hand or pare down its debt burden.
Companies that fail to generate free cash flow are typically those that are exhibiting high-growth, which means they need to reinvest cash flow into their working capital or one which requires a consistently high amount of capital expenditure to maintain its competitive advantage (or lack of).
Dividend investors typically look for companies that consistently generate free cash flow in virtually every environment.
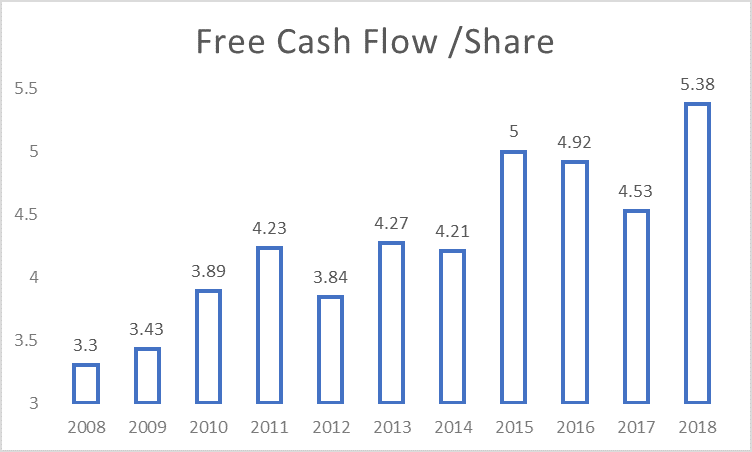
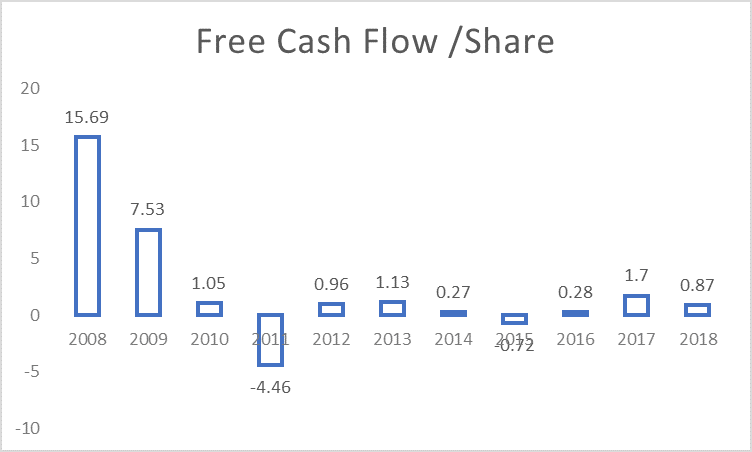
The above diagram illustrates the free cash flow/share profile of McDonald’s. Its operations require little capital and the company is a recession-proof company that typically enjoys high “recurring” revenue, resulting in extremely consistent free cash flow generation.
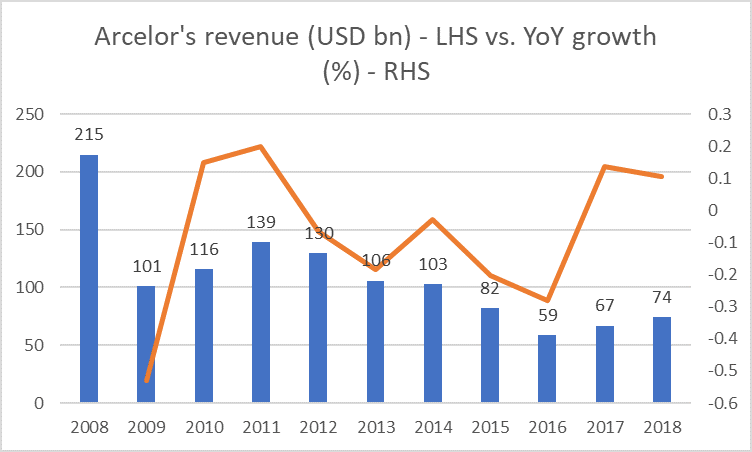
On the other end of the spectrum, you have a company like Arcelor Mittal, a steel company that has been an unpredictable free cash flow generator. Being a commodity company, Arcelor is a price taker for its steel products. When times are good and the economy is expanding, demand for its products is strong and the company might benefit from stronger product pricing.
In a recession, the converse might be true.
Looking at free cash flow generation alone, the choice is clear. A dividend investor will select McDonald over Arcelor Mittal as the former is the clear winner in terms of dividend payment reliability.
Using Free Cash Flow against Enterprise value has also proven to be one of the best if not the best valuation metric as a stock price predictor
Dividend Investing Strategy Key Ratio #4: Return on Invested Capital
Imagine if you have got $100 to invest. Venture A can turn that $100 into $105 while Venture B can turn that $100 capital into $110. One would pick Venture B to invest the $100 as it can grow your money faster.
This is a simple analogy to explain what return on invested capital or ROIC (in short), is all about. Businesses will take funds (either equity or borrowings) and invest to generate a return for shareholders.
ROIC = Net profit / (Total debt + Total Shareholder Equity)
A simpler financial ratio, which is one of Warren Buffett’s favorite is to find companies with high Return on Equity or ROE for short. ROE is calculated as Net profit / Total Shareholder Equity
Using ROIC takes into account a company’s capital structure so we can better compare them. A company with zero debt will have the same ROIC and ROE ratios.
Why is ROIC a better financial ratio vs. ROE?
Let’s use an example to illustrate the concept of ROIC.
Assume two kids, Peter and David, both started a business of selling chewing gum to the local community. Peter generated $20 in profits vs. David which generated $18 in profits. On the surface, it might seem that Peter did a better job of running his chewing gum business.
Our entrepreneurial kids decide it is now time to invite the public to partake in their businesses. Before jumping to the conclusion that Peter’s business is the superior one to invest in, let’s take a step back and look at the capital employed by both kids.
To achieve a profit of $20, Peter used his savings of $100 (equity) and borrowed an additional amount of $50 (debt) from his parents to fund his chewing gum business.
David, on the other hand, used only his savings of $100 (equity) to start up his business without any borrowings.
Using the ROE metric, one would have concluded that Peter, with an ROE of 20 / 100 = 20% is superior to David with an ROE of 18 / 100 = 18%.
However, note that Peter used extra funding (debt) of $50 which he borrows from his parents to generate that $20 in profits. Without that extra capital, his profit might have been way lower than $20.
Using the ROIC metric, the ROIC for Peter would have been 13.3% (20 / 150) while that of David would have been 18% (18 / 100).
David is more superior in deploying his resources/available capital to generate earnings in this example. Put it simply, Company A can generate 2x the amount profits of Company B, but if Company A requires 10x the amount of capital to achieve that, then it’s far inferior to Company B in terms of capital deployment.
When we analyze a company’s return on invested capital, we look at the level (ideally more than 15%) and the consistency of its returns (does it generate ROIC of 15% one year which drops to 5% the next? Or is this ratio consistently stable?)
Stable, mid-high teens return on invested capital over many years is often a positive signal that one is looking at a highly profitable, efficient company that demonstrates an economic moat.
I have written about stocks with high ROIC as the key investment metric that is leads to outperformance.
Dividend Investing Strategy Key Ratio #5: Sales Growth
Sales growth is a basic financial metric that subtracts one period’s revenue from the prior year’s revenue and expresses the differences as a percentage of the earlier year.
Sales growth = (Year 2 Sales – Year 1 sales) / Year 1 sales
While generating operating profits and free cash flow scores high in terms of our financial check-list, the ability to demonstrate consistent sales growth shows that a company has a viable growing business with a strong structural uptrend vs. one that is cyclical where the risk of buying near/at the peak is a sure formula to lose money – quickly.
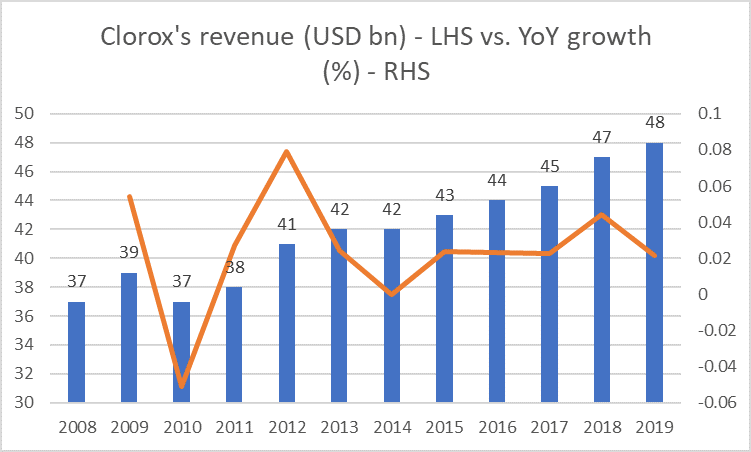
For example, would one be more comfortable buying into a cyclical business-like Arcelor Mittal or a stable growing consumer staple company like Clorox?
All else equal, we prefer to hold businesses that sell products and services with more stable demand.
Dividend Investing Strategy Key Ratio #6: Net Debt to Equity
Financial leverage can often be a double-edged sword. During good times, the usage of cheap debt is an excellent way to grow a business. However, when times are bad, the banks will be the first one that comes knocking on your door.
Hence it is for that very reason that we will like a company to demonstrate a low net debt to equity ratio, preferably less than 60%.
This ratio is simply calculated as:
Net debt to equity = (Total debt – Total Cash) / (Total shareholder’s equity)
A company that has a high net debt to equity might find that they have to prioritize the payment of interest and repayment of debt vs. making dividend payments when the going gets tough. Companies will always pay their debt obligations before paying a dividend.
Alternatively, a company with a strong balance sheet with plenty of cash could be in net cash to an equity position.
Notwithstanding the issue of efficient capital structure, such a company will be in a very comfortable position to continue making dividend payments, even if its core operations might be facing short-term hiccups that result in a decline in both revenue and earnings in the interim.
Dividend Investing Strategy Key Ratio #7: Total Shareholder Return
While looking at a company’s dividend yield is one way of getting started on building your portfolio of dividend counters, one should keep THE big picture in sight.
THE big picture is to look at Total Shareholder’s Return.
Total Shareholder’s Return = Dividend return + Capital appreciation return
Granted that capital appreciation of a counter is often not within one’s control and could exhibit significant variation in a volatile market, the idea is not to solely focus on the yield potential of a stock.
What good is a counter if it provides a high yield of 6-8%/annum but whose share price consistently declines by 10-20%/annum, resulting in a negative total shareholder’s return?
When a company has persistently destroyed shareholder value, investors need to ask themselves why this trend would reverse any time soon. Is there a structural decline in the company’s business model or the industry as a whole that will not result in any significant share price appreciation any time soon?
Dividend Investing Strategy Key Ratio #8: Share Buy-Backs
While not viewed as a direct manner of returning wealth to shareholders, share buybacks are now viewed as a flexible practice to put money back into shareholders’ pockets. There has been a huge debate of late about corporates engaging in debt to fund share buybacks (look at airline companies). We prefer these buybacks to be funded with free cash flow regardless of how cheap debt might be.
By definition, stock buybacks allow companies to reinvest in themselves by reducing the number of outstanding shares on the market. A company can pursue a policy of returning wealth to shareholders by 1) paying dividends, 2) share buybacks or 3) a combination of both.
A company that reduces its outstanding shares through share buybacks will automatically increase its dividend per share (same dividend amount divided by a lower denominator).
Let’s take Clorox as an example
The company has been consistently reducing its outstanding shares from 139.6m in 2008 to 125.9m in 2019.
During this time, dividend payments increased from USD$228m to USD$534m or a CAGR growth of 8%
Dividend per share (DPS) increased from USD$1.60 to USD$4.24 or a CAGR of 9.3%. The differential in the compounded annual growth rate is due to the effect of share buy-back. If the number of outstanding shares remained as 139.6m in 2019, 2019 DPS would have been USD$3.83 vs. $4.24.
The above 8 key financial ratios to screen and identify good dividend stocks is a useful way to get started on your dividend investing strategy.
The next step would be to combine those financial ratios with an evaluation of the company’s economic moat.
What is an economic moat?
This term was invented by the legendary Mr. Warren Buffett who believes that if a company possesses an economic moat (sustainable competitive advantage), it will be in a good position to not just thrive but excel over its competitors.
Having an economic moat is what separates a good business from a bad one, a reliable dividend payer from a risky one, and an attractive total return from a mediocre one.
Virtually every business faces competition unless they are in an enviable position of being a monopoly. However, only some businesses can successfully defend their operations from competitive threats due to the presence of one or more economic moats or competitive advantage.
Below are various forms of economic moats which I believe will be useful in complementing the 8 financial ratios highlighted above in our dividend investing strategy.
Economic moat #1: Strong Pricing Power/High switching cost
If a company has got strong pricing power, it can raise its product/service prices every year and yet does not have to worry about losing its business to competitors. According to Warren Buffett, this is probably the single most important decision when evaluating a business. He made this comment about his investments in Moody’s
“Dun and Bradstreet had a very good business, and Moody’s had an even better business. And basically, the single-most-important decision in evaluating a business is pricing power. If you’ve got the power to raise prices without losing business to a competitor, you’ve got a very good business. And if you have to have a prayer session before raising the price by a tenth of a cent, then you’ve got a terrible business. I’ve been in both, and I know the difference”.
Warren Buffett
For a company to grow its revenue, its either through volume or price or both. It might be possible for a company to ramp up volume sales by undercutting its competitors on price. However, to be able to increase its product/service prices and not worry about losing its customers to competitors indicates the presence of this strong economic moat. Companies with pricing power can withstand economic slowdowns better than most and are in a strong position to defend their market share.
A company that ticks the boxes on all the above 8 key financial ratios highlighted with boast strong pricing power is Microsoft.
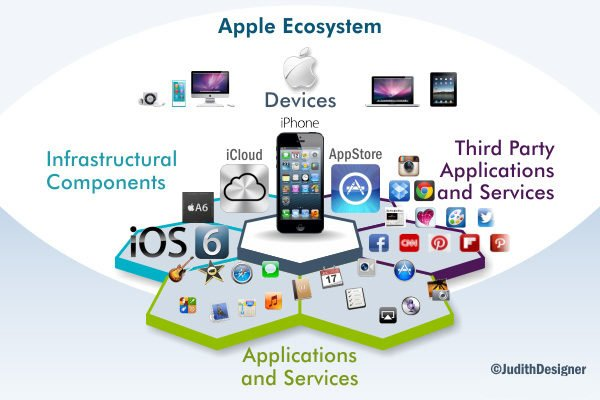
Another dividend-paying company that has high switching cost which results in stronger pricing power is Apple. The company has successfully created an ecosystem that has become its strongest economic moat. For an iPhone who has been so accustomed to using the suite of Apple-related products such as iTunes, iCloud, iPad, MacBook, switching to an android phone will be a major hassle.
This thus allows Apple to increase prices (look at how the prices of iPhones have trended up over the years with each upgrade) and yet not be concern about losing customers to competitors.
Economic moat #2: Strong cost advantage
Companies with huge economies of scale can deliver their goods or services at a low cost and thus have a distinct competitive advantage.
The best example here will be Walmart. It is a low-cost producer and its low costs allow it to price its products the most attractively. It has huge operating leverage which it uses effectively to keep costs low for consumers. Given its size, the company is in a strong bargaining position with its suppliers to get the best pricing terms for itself and its customers.
Walmart recognizes that it is operating in a commodity industry. Everybody can get their hands on toilet papers (maybe not in today’s context) to re-sell. That is why it is relentless in reducing its costs. The lower you go, the deeper the moat.
Besides bargaining power with suppliers, a key reason why Walmart can enjoy this moat s due to the management of Walmart stores as a network. The company limits cost through a management and distribution structure that serves multiple stores in a geographic area. The network of stores allows Walmart to limit its stock in any given store and share managerial expenses across the network. The moat is deep—efficiencies flow from a 5,000-store network.
Walmart is also a company that ticks all the 8 financial ratios/metrics above and yet possess this moat.
Using another example from Warren Buffett himself, he describes his insurance arm GEICO as a company that possesses this moat. GEICO did not stumble upon low-cost production as its moat. It was essential for the market.
“Most people will assume the service is fairly identical among [car insurance] companies, or close enough, so they’re going to do it on cost, so I gotta be the low-cost producer. That’s my moat. To the extent my costs get further lower than the other guy, I’ve thrown a couple of sharks into the moat”.
Warren Buffett
Economic Moat #3: Intangible assets/strong branding
These are companies that possess a strong brand that is immediately recognizable or a huge pipeline of patents that protects the pricing power of its products. These are assets that are not easily quantifiable.
Intangible assets can include government licenses, intellectual property, trademarks, copyrights, patents, government licenses, etc.
Many pharmaceutical companies depend on their intangible assets ie patents to protect their pricing power for key products or prevent competitors from duplicating their products. When patents expire, generic competition can quickly push the prices of drugs down more than 80%.
Another well-known dividend payer example will be Starbucks. This company ticks all the 8 key financial ratios and has been a dividend payer since 2010. While there might be some concerns over COVID-19 driven store closures affecting the company’s earnings in 2020, the branded coffee chain-store will likely emerge out of this crisis unscathed and potentially gain market share from less well-known branded coffee stores.
According to a recent BAV Group research, Starbucks score highly in terms of brand esteem and differentiation, alongside Apple and Amazon.

According to Morningstar, Starbucks’ wide economic moat comes from its brand intangible asset that commands premium pricing combined with meaningful scale advantages. With a widely recognized brand, Starbucks is among the few retail concepts to be successfully replicated across the globe.
(Quick hack: For those looking to get access to Morningstar latest analysis report on companies, type the following “analysisreport.morningstar.com” followed by the stock name in google. Find Morningstar latest Starbucks report)
Economic Moat #4: Network Effect
The network effect is one of the most powerful competitive advantages and it is also one of the easiest to spot.
A network effect is present when the value of a particular good or service increases for both new and existing users as more people use that good or service.
Facebook is the most well-known example of possessing network moat, however, the counter does not yet pay any dividends. When a network has strong social engagement like Facebook, adding more users increases the value of the network for everyone.
Amazon is another well-known example but it too does not pay a dividend. Where a network matches buyers and sellers like Amazon, increasing the network size increases choice and by extension, value.
Another company that has a huge network effect and recently started paying a dividend in 2019 is eBay.
The term “critical mass” is often used in connection with the network effect. If the user base for a product or service reaches a critical mass, the network is likely to expand under its power. The main barrier to the network effect’s taking place is getting enough users so that the effect occurs. At critical mass, the value obtained will be greater than or equal to the price paid for the goods or services.
eBay manages its end consumers and merchants through their websites. Consumers aren’t interested in buying from these websites unless there are a variety of products available, which means that enough merchants must be present. Once the users arrive, more merchants will start coming oo board, and eBay will start enjoying the maximum benefit of the network effect.
Conclusion
While investing involves plenty of unknowns and a large degree of uncertainty at times, a dividend investor can reduce committing avoidable mistakes in his/her dividend investment journey by focusing on these 8 key financial ratios/metrics.
When combined with the presence of wide-moat businesses, this dividend investing strategy will excel even further.
Join our Telegram broadcast: https://t.me/gemcomm
SEE OUR OTHER WRITE-UPS
- 4 RECESSION-RESISTANT STOCKS WITH A FORTRESS BALANCE SHEET
- DIVIDENDS ON STEROIDS: A LOW-RISK STRATEGY TO DOUBLE YOUR YIELD
- DIVIDEND YIELD THEORY – THE UNDERAPPRECIATED VALUATION TOOL
- A LIST OF “BEST” DIVIDEND GROWTH STOCKS
- VALUE INVESTING IN SINGAPORE: 10 SG VALUE STOCKS THAT MIGHT MAKE SENSE
- 7 GOLDEN RULES OF DIVIDEND INVESTING
Disclosure: The accuracy of the material found in this article cannot be guaranteed. Past performance is not an assurance of future results. This article is not to be construed as a recommendation to Buy or Sell any shares or derivative products and is solely for reference only.


