
Before you start investing in individual stocks, it is very useful to recognize and interpret some of the key financial ratios that are critical in identifying a good stock.
Back in Nov 2019, I wrote the article: The Best Predicator of Stock Price Performance which was a study done by Morgan Stanley. Long story short, the honor of best stock price predictor was Free Cash Flow divided by Enterprise Value.
This is similar to earnings yield which is Earnings / Price. Most are probably more familiar with its inverse which is the Price / Earnings ratio (P/E).
Similarly, we can also use Enterprise Value / Free Cash Flow as a better alternative to P/E to gauge the financial valuation of a company.
Let me use an example. In my article: 8 Outperforming Stocks to buy now (part 2), I highlighted a stock called Fortinet which is a security vendor that sells products, support, and services to small and midsize businesses, enterprises, and government entities.
The company was then trading at a forward P/E ratio of 46x (now 68x) with a market cap of close to US$22bn. That looks like a very high multiple which is not uncommon for a growth stock.
The company is in a net cash position of US$2bn, so its current enterprise value (Market cap – net cash) is US$20bn. The company is on track to register US$1bn in free cash flow in 2020. That puts its Enterprise Value / Free Cash Flow at 20x ($20bn market cap / $1bn in free cash flow).
That is way lower than its current forward P/E ratio of 46x. With a Free Cash Flow that is growing at a rate of 30%/annum, Fortinet’s 2021 Enterprise Value / Free Cash Flow could be at only 15x. The company now seems to be exuding some characteristics of value.
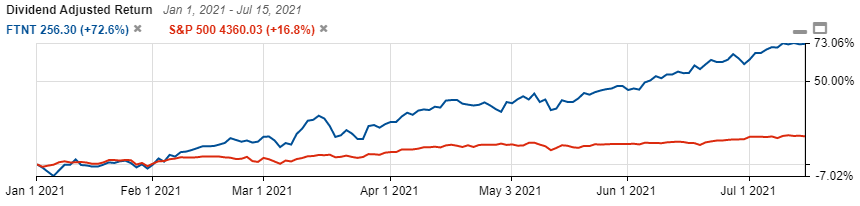
On a YTD 2021 basis, FTNT has been one of the strongest outperforming stocks in the S&P 500 as seen from the chart below.
In this article, I like to highlight some key financial ratios that are critical in identifying a good GROWTH stock with VALUE characteristics, one where the company is not solely dependent on a “sexy growth story”.
Value vs. Growth
The topic of value investing vs. growth investing has been around for donkey years and there is always a debate as to which is a better investment methodology. Pro value investors will claim that value investing remains the superior methodology based on their long-term (more than 20 years) outperforming returns vs. their growth counterpart while growth proponents will highlight that the changing macro-economic landscape (low-interest rate, Quantitative Easing) will continue to fuel growth stocks’ superiority in the coming decade over their value counterpart, similar to the past decade.
Value Investing focuses more on their relatively low financial multiples such as P/E, Price to Book (P/B), Price to Free Cash Flow (P/FCF), low net debt to equity, etc which might indicate a certain level of undervaluation. These stocks tend to have low/no growth in their revenue/earnings.
Growth Investing, on the other hand, focuses on stocks where they are experiencing strong growth in top and bottom-line, without much regard to how “expensive” their P/E, P/B ratios might be.
Can one have the best of both worlds?
Can we find growth stocks with value characteristics?
Key Financial Ratios #1: Double-digit growth in Revenue
All growth stocks have to exhibit a growing revenue characteristic. This is likely the key determinant that is fuelling their share price, particularly for those companies that are not generating any earnings at this point.
Growth stocks with no earnings are particularly susceptible to a recession, like the one which we are currently already in. An economic recession could trigger a halt in its revenue growth or even result in a decline.
This might translate to a significant de-rating in its Price / Sales multiple (the most common valuation multiple uses to value a growth stock with ZERO earnings) where the consequence is a collapse in its share price.
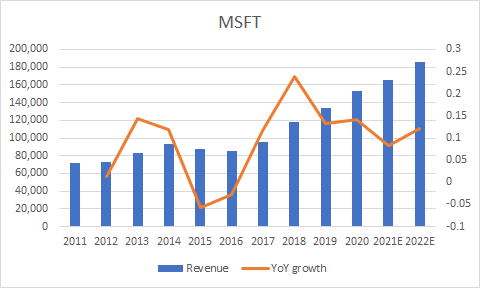
A growth stock, depending on its market cap size should exhibit at least double-digit in top-line growth for the past 5-years, with that trend continuing in the years ahead. Microsoft, the 2nd largest market cap company in the world currently, is still growing its top-line at a double-digit rate for the past 5 years, with expectations for sales growth in 2021-22 to be relatively robust as well.
Key Financial Ratios #2: Growth in operating margins
The second key financial ratio that I believe should be found in any good growth stock is a gradual appreciation in the company’s operating margins.
This is often termed as operating leverage where revenue growth rises at a much faster pace than operating expenses (due to a large fixed expense component).
I noticed that companies with a growing revenue trend that is supplemented by an improving operating margin landscape tend to perform very well in terms of their share price performance. This is very logical as:
Higher operating margins ==> Faster growth in Operating profits
When combined with low debt/low financing expenses, this tends to result in a faster rise in net profit or a decline in net losses, ultimately translating to higher share prices.
A good growth stock should exhibit bottom-line growth that is faster than top-line growth, fuelled predominantly by operating margins improvement seen across at least in the last 2-3 years.
A particular company that is on my radar is POOL, which is a company that I highlighted in this article: 5 Best Blue Chip Growth Stocks. The company operates a very simple business of providing swimming pool supplies and related products. However, despite the simplicity seen in its business model, the company has been able to grow its Net Income Margin consistently over the past decade (as a result of net income growing faster than sales)
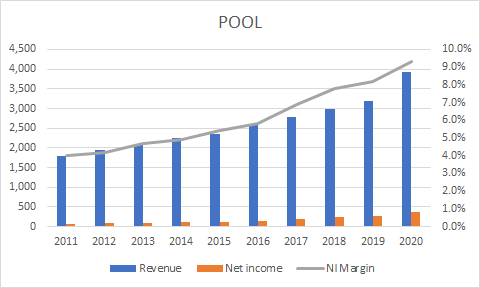
Over the past 5 years, this counter has appreciated by 358%, making it one of the best performing blue-chip growth stocks in the S&P 500.
Key Financial Ratios #3: Low net debt to equity ratio + reduction/ stable outstanding share base (Value characteristics)
Growth stocks tend to have a weak balance sheet where their top-line growth is being fuelled by capital raised from bank borrowings or credit funding. Alternatively, if they do not have access to the debt market, they will have to raise funds through equity issuance.
This will result in a low “net debt to equity ratio”. That is why we need to combine a low net debt/equity ratio alongside a reduction/stable outstanding share base to ensure that equity dilution is not in play.
Value stocks tend to exhibit such a characteristic of having a low net debt/equity ratio alongside a declining share base as the huge amount of free cash flow generated from their business can only be used to retire debt or return to shareholders in the form of share buybacks and dividends.
The opportunity of recycling capital into the company to fuel organic revenue growth is comparatively lower compared to growth stocks.
Ideally, I will like to see a low net debt/equity ratio of <0.7x. However, this should be evaluated on a case-by-case basis. Stocks such as McDonald’s, Disney, etc which have been aggressively buying their shares could translate to a very low or negative equity base, thus artificially inflating their net debt/equity ratio.
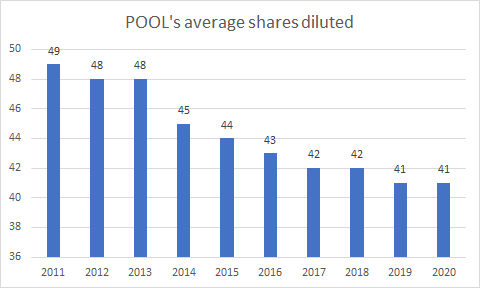
Using POOL as an example again, the company has been consistently buying back its shares, with its outstanding share base reducing from 49m in 2011 to 41m in 2020. This has helped to bolster its growth in EPS, which has a 10-year CAGR of 22%.
Key Financial Ratios #4: Strong Free Cash Flow generation (Value characteristics)
To grow top-line, some growth stocks have to invest heavily in their CAPEX, resulting in a significant decline in their free cash flow or even translating to negative free cash flow.
In our article on Outperforming stocks (Part 1) and (Part 2), we notice that despite many of these companies being growth companies, they remain hugely free cash flow positive.
The beauty of these businesses is that they require low CAPEX to further grow their businesses once the initial infrastructure is in place.
Again, referring to our example above on Fortinet, this is a company that is trading at a then forward P/E ratio of 46x but only at a forward 2020E Enterprise Value / Free Cash Flow multiple of 20x with the potential to reduce that multiple to only 15x in 2021, based on its 30% historical free cash flow growth rate.
This is a characteristic that is often exhibited by value stocks and not growth stocks. As highlighted, value stocks tend to be corporations that have achieved a certain level of operational stability. They generate a ton of free cash flow but the scope for re-investing them for organic growth is low. Many of these companies tend to return excess cash to shareholders in the form of dividend payments and share buybacks.
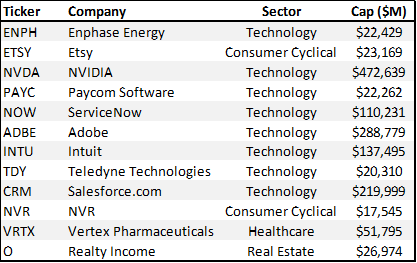
If one is able to find a growth counter that requires minimal Capex to sustain its growth momentum, then you might wish to keep a close watch on the counter. The table below highlights the 12 Stocks where I used the Stock Rover Screener to screen for blue-chip S&P 500 stocks that are expected to witness 10% growth in sales and have been growing their Free Cash Flow consistently for the past 5-years.
Key Financial Ratios #5: Strong ROIC
All 8 Outperforming stocks which I highlighted in my previous two articles on best growth stocks exhibit a common financial metric.
That is a high Return on Investing Capital (ROIC) ratio. For those who are not familiar, ROIC is calculated by:
ROIC = Net Profit / (Shareholders Equity + Debt) (Simplified version)
This is similar to the Return on Equity (ROE) ratio but instead of using purely shareholders’ equity in the denominator, we add “debt” as an additional component. Companies with a huge amount of debt raised to drive profits will exhibit a much lower ROIC ratio compared to their ROE ratio.
ROIC is a favorite Warren Buffett ratio that is used to assess a company’s efficiency at allocating the capital under its control to generate returns.
Most if not all of the 8 companies I featured have an ROIC ratio above 20% which is likely to be way more than their cost of capital (cost of debt + equity financing). These companies tend to exhibit economic moats which will allow them to stay ahead of the competition and generate the same high ROIC level in the foreseeable future.
However, a high ROIC requirement will essentially exclude early-stage high-growth companies that are still generating losses. For loss-making stocks, having a strong balance sheet while still generating cash flow to support future growth will take precedent in this case.
Conclusion
These 5 key financial ratios are what I feel are important characteristics of a good growth stock, some of which incorporate value fundamentals as well.
Besides these 5 key financial ratios, other non-quantitative components should also be evaluated such as recurring revenue level, durable intangible assets (such as branding power), management quality, the appeal of the product to the mass market, network effect, etc.
Join our Instagram channel for more tidbits on all things finance!
SEE OUR OTHER WRITE-UPS
- 8 OUTPERFORMING STOCKS TO BUY NOW (PART 1)
- 4 STOCKS WITH MORE THAN 80% RECURRING REVENUE OWNED BY GURUS
- WHAT DO NETFLIX, ALIBABA, DBS, MICROSOFT HAVE IN COMMON?
- 10 “MUST-HAVE” STOCKS FAVORED BY MOTLEY FOOLS US
- 10 GREAT REASONS FOR REITS INCLUSION IN YOUR PORTFOLIO AND 3 REASONS TO BE CAUTIOUS
- WHY I AM STILL BUYING REITS EVEN WHEN THEY LOOK EXPENSIVE
Disclosure: The accuracy of the material found in this article cannot be guaranteed. Past performance is not an assurance of future results. This article is not to be construed as a recommendation to Buy or Sell any shares or derivative products and is solely for reference only.


1 thought on “5 Key Financial Ratios to identify Good Growth Stocks”
Hi,
How do you derive the screener for consistent FCF growth using Stock Rover on your criteria 4 to generate the list? I am unable to find that criteria under the screener. Thanks.