I have written about value investing previously in this article which focused on value investing in Singapore. In that article, I highlighted several value stocks that can be found in Singapore such as iFast Corporation which has gone on to become a multi-bagger in a short period.
In this article, I like to focus more on US stocks with a key criterion that these value counters have outperformed the general market over the past 3, 5, and 10 years, a huge achievement considering how value stocks have lagged that of their growth counterparts over the past 2 decades. There are still gems to be found if one searches hard enough.
But first, let’s answer the question: Is Value Investing Dead?
Is Value investing dead?
Investing in value stocks has not been an easy route for a value investor as their performance would have lagged the general market and more so to their growth counterparts rather substantially.
So much so that Ted Aronson is closing his value-oriented money management firm AJO Partners and sending back his investors’ $10bn because he has grown increasingly dissatisfied with his investment performance and doesn’t want to keep fighting a losing battle against the market.
However, if you studied history or financial markets, you that nothing lasts forever. Is Tod Aronson abandoning ship just as the tide is beginning to turn in Value’s favor? The team at JP Morgan certainly thinks so when they recently put up this article: What would it take for value to outperform again?
According to JPM, the underperformance of value relative to growth since 2007 is now approaching levels only seen during the 1930s and the dot com bubble.
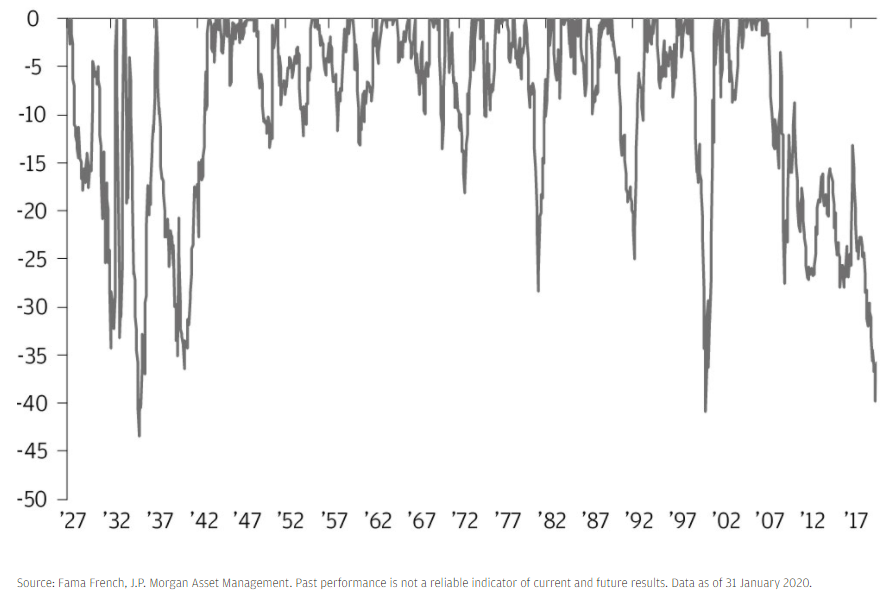
Usually, after such significant periods of value underperformance, the snapback in favor of value has historically been large and quick. We have seen that happening recently when Pfizer’s announcement of a successful vaccine trial triggered a mighty rebound in value counters such as banks, energy plays, etc.
Pfizer left out the “small” detail that such vaccines have to be kept at about -70 degrees Celsius a temperature cold enough to harden ice cream into a spoon-breaking block of ice and that only specialized freezers can produce. No wonder, its CEO sold US$5.6m worth of shares on the day of its big vaccine news.
Is this time different?
The team at JPM also asked this million-dollar question. Is this time different? Will the underperformance of value investing continue vs growth investing?
They believe there are two scenarios in which value could outperform growth again.
1. Recession
In boom times investors are often willing to fund businesses that don’t make any money, but during a recession, investors are historically more likely to want to own companies with strong balance sheets that can withstand a downturn.
The number of companies listing who don’t make any money has reached levels not seen since the dot com bubble, which may serve as a warning that some young growth stocks could be particularly vulnerable during the next recession.
2. Reflation
While higher interest rates don’t always cause value stocks to rise by more than growth stocks, as seen during the brief period in this cycle where interest rates increased, higher interest rates do often benefit financial stocks, and therefore also support value investing.
A reflation scenario, on the other hand, is viewed by most investors as very unlikely. While I agree that in the near-term higher interest rates and commodity prices are relatively unlikely, there is a tail risk that the reflation narrative could gain momentum if governments turn towards greater fiscal stimulus.
I have written about the possibility of stagflation happening that could drive interest rates higher. This might spell the end game for the bull market.
JPM believes that investors with a big bias towards growth stocks over value stocks are vulnerable to recession, reflation, and regulation. Therefore, they believe it is time to consider rebalancing portfolios to a more neutral balance between growth and value stocks after such a long period of growth outperformance.
Investing in Value Stocks
Difficulty in assessing a value counter
For value investors, they tend to focus on a few key financial metrics such as Price to Earnings Ratio (PER), Price to Book Ratio (PBR), Dividend Yield, etc, selecting stocks which tend to exhibit relatively low ratios in these financial metrics.
Such financial metrics, however, should not be viewed on an absolute basis but more on a relative basis.
Meaning that Company A which exhibits a lower PER ratio compared to Company B might not necessarily be a “Value” counter. The comparison of PER ratios should be benchmarked against sector peers as well as its historical PER band.
So, Company A which spots a PER of 15x might be erroneously viewed to be “of value” than Company B which spots a PER of 25x. Yes, from a theoretical angle, Company A is “cheaper” than Company B from an earnings angle.
But what if I say that comparable peers in Company A’s industry/sector are trading at only an average PER multiple of 10x. Is Company A still considered cheap? What if I also add on that Company A has a 10-year historical PER band of between 8x-15x. This means that it is now trading at the top of its historical PER band.
Should Company A be viewed as a Value counter?
On the counter hand, Company B’s peers are trading at average PER multiples of 50x and the company’s historical 10-year PER band is between 25x-50x. Is it expensive? Or is Company B now a value play?
Proper Screening of value stocks
When it comes to screening for value stocks, most retail investors will use a blanket multiple, say below 15x PER (alongside other valuation metrics), and claim that stocks that fulfill the criteria on these financial metrics are thus value counters.
However, using a relative basis is much more useful. One where we benchmark the counter’s financial ratios against its industry peers as well as its historical trading range.
I tend to rely on a fantastic fundamental stock screener like Stock Rover to do the heavy lifting for me.

Stock Rover
An All-in-one Fundamental Stock Screener that EVERY serious investors should have in their investing arsenal.
This is my GO-TO Stock Screener for evaluating US stocks and ETFs
Stock Rover has developed its own proprietary Value Score ranking criteria which looks rank a stock based on value metrics such as a counter’s EV/EBITDA, PER, EPS predictability, Price/Tangible Book, and Price/Sales. Some of the metrics such as Price/Tangible Book and Price/Sales are benchmarked against sector peers whereas the other metrics are compared across all stocks with adequate data.
The best companies score a 100 and the worst score a 0.
Using Stock Rover’s Value Score criterion is an easy way to sift out counters which exhibit value characteristics, not simply because of its low PER ratio but also using multiple financial metric considerations.
I hence screened for Value Stocks using Stock Rover’s Value Score criterion of having a Value Score > 85. There is a total of 108 S&P 500 companies that meet these criteria.
One would have expected a huge list of Energy stocks, but surprisingly, ZERO Energy stocks meet Stock Rover’s Value Score despite their substantial share price decline over the past year.
From this list of 108 value stocks, 12 value stocks have consistently outperformed the S&P 500 over the past 3, 5, and 10-years.
I further refined the list of 12 value stocks into just 5. These value stocks meet the following criteria:
- Stock Rover Value Score > 85
- Annualized 3,5 and 10 years return more than S&P 500 returns
- Positive 1-year forward EPS growth
- ROE more than or equal to 15%
I have briefly discussed criteria 1-2 previously. Criterion 3 takes into consideration that the counter is not a “value trap”, one where it is cheap due to a negative earnings growth profile.
I have written about ROE (criterion 4) previously in this article: What is ROE? Which S&P 500 stocks have strong ROE ratios which I believe is a useful financial ratio to use to gauge the possible presence of an economic moat in a company.
Without further ado, let me present the 5 Value Stocks which meet these criteria. The table showing the financial criteria of the 5 Value Stocks will be summarized at the end of the article.
Value Stock #1: UnitedHealth Group (UNH)
UnitedHealth Group is the largest private health insurance provider in the United States, offering medical benefits to nearly 50 million members across its U.S. and international businesses.
As a leader in employer-sponsored, self-directed, and government-backed insurance plans, UnitedHealth has obtained a massive scale in managed care.
Along with its insurance assets, UnitedHealth’s continued investments in its Optum franchises have created a healthcare services colossus that spans everything from medical and pharmaceutical benefits to providing outpatient care and analytics to both affiliated and third-party customers.
The counter has an almost impeccable track record when it comes to growing its sales and earnings as shown below:
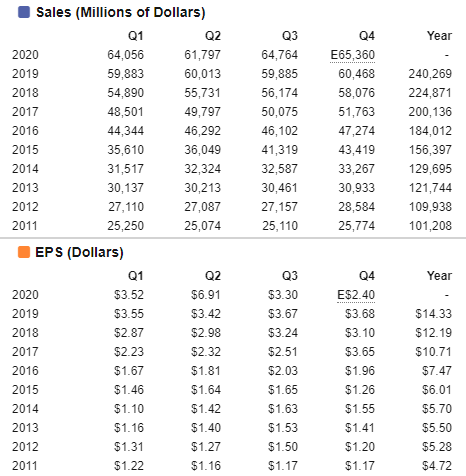
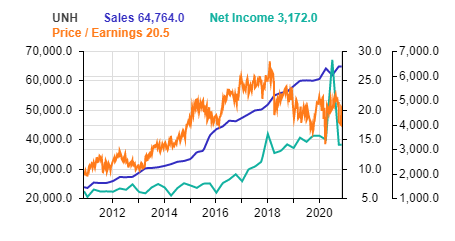
The chart below summarizes its sales, net income, and PER trend. The counter is not trading excessively in terms of its historical 10-year PER band.
The street is generally very positive of the counter, with 15 Positive ratings, 3 Neutral ratings, and 0 Negative ratings.

Value Stock #2: Humana (HUM)
Another health-related stock, Humana is one of the largest private insurance health insurers in the U.S. with a focus on administering Medicare Advantage plans.
The firm has built a niche specializing in government-sponsored programs, with nearly all its medical membership stemming from individual and group Medicare Advantage, Medicaid, and the military’s Tricare program.
The firm is also a leader in stand-alone prescription drug plans for seniors enrolled in traditional fee-for-service Medicare. Humana offers employer-based plans primarily for small businesses along with specialty insurance offerings such as dental, vision, and life.
Beyond medical insurance, the company provides other healthcare services, including primary-care services and pharmacy benefits management.
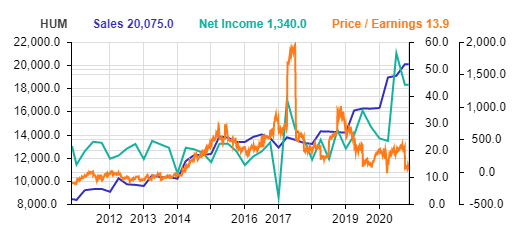
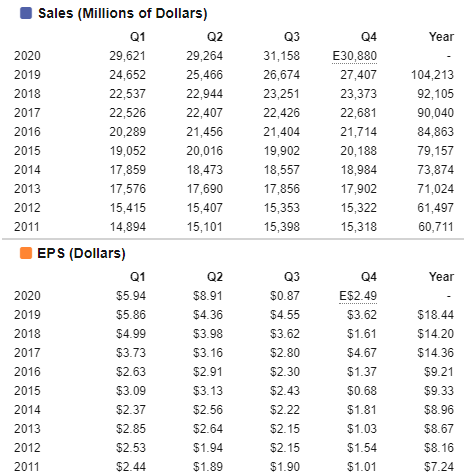
Compared to UNH, HUM’s historical earnings performance is slightly more patchy, with periods of negative earnings growth, particularly in the 4th quarter where EPS could be negative.
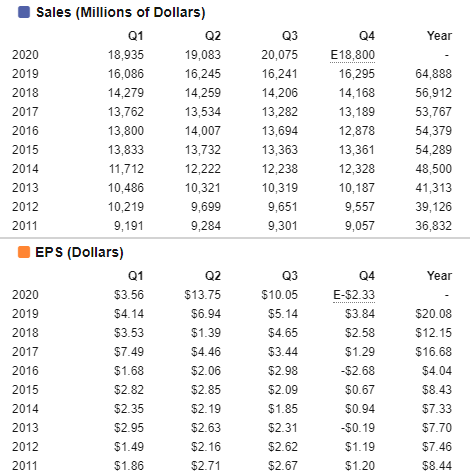
The chart below summarizes its sales, net income, and PER trend. The counter is currently trading at the lower band of its historical 10-year PER band.
The Street is also generally positive about HUM, with most giving a positive rating to the counter.

Value Stock #3: Anthem (ANTM)
The 3rd private insurance company on the list, Anthem is one of the largest private health insurance organizations nationwide, providing medical benefits to roughly 42 million medical members.
The company offers employer, individual, and government-sponsored coverage plans.
Anthem differs from its peers in its unique position as the largest single provider of Blue Cross Blue Shield branded coverage, operating as the licensee for the Blue Cross Blue Shield Association in 14 states.
Through acquisitions, such as the Amerigroup deal in 2012, Anthem’s reach expands beyond those states through government-sponsored programs such as Medicaid, too.
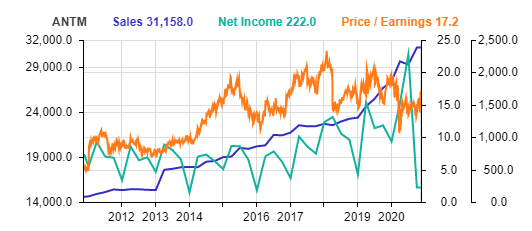
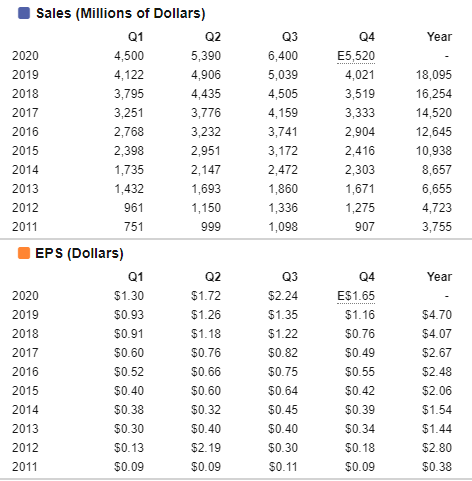
Similar to its peers UNH and HUM which are also on this list, ANTM has been steadily growing its sales and earnings in the past decade.
Its current PER is at 17x but that multiple is expected to compress to 13x in 2021.
Most analysts in the street have a generally positive view of ANTM as well.

Value Stock #4: D.R. Horton (DHI)
D.R. Horton is a leading homebuilder in the United States with operations in 90 markets across 29 states. The company mainly builds single-family detached homes (90% of home sales revenue) and offers products to entry-level, move-up, luxury buyers, and active adults.
The company also offers homebuyers mortgage financing and title agency services through its financial services segment. D.R. Horton’s headquarters are in Arlington, Texas, and it manages five regional homebuilding offices across the United States.
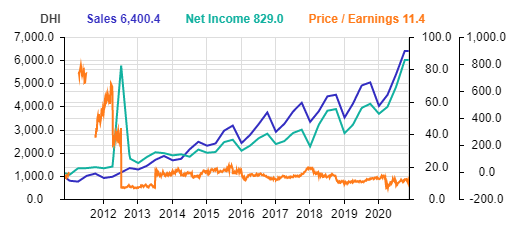
D.R. Horton sales have been outstanding, with EPS increasing from $0.38 back in 2011 to the forecasted amount of $6.91 in 2020, a record level.
As seen from the chart below, Sales and Net Income has been on a steady uptrend over the past decade. Its historical PER multiple bands have been skewed in the early years. With a forward PER multiple of 8.5x, the company is currently trading at its lower PER multiple bands.
Again, the street is generally positive with the counter as seen from the table below, with several upgrades from Hold to Buy in the last month.

Value Stock #5: Leidos Holdings (LDOS)
A company not well-known, Leidos Holdings Inc is engaged in scientific, engineering, system integration, technical services, and solutions to various government entities and highly regulated industries, including the U.S. Department of Defense, Intelligence Community, and the British Ministry of Defense.
Areas of focus include intelligence and surveillance, cybersecurity, complex logistics, energy, and health.
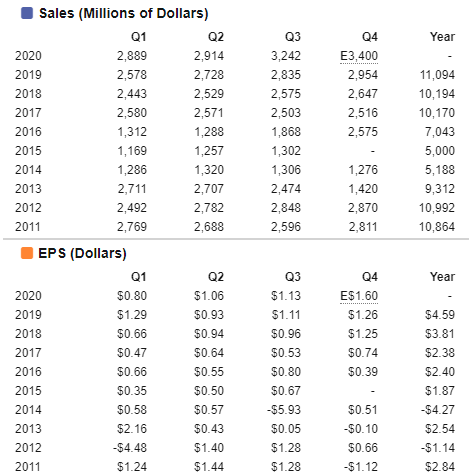
Among the stocks that I have discussed thus far, this stock’s financial performance has the greatest variability as seen from the table below.
Its sales and earnings performance in the last 5-years has been much better compared to the previous 5-years, with steady EPS growth since 2014. Due to its government contract nature, there is likely no earnings seasonality present, and earnings might be lumpy.
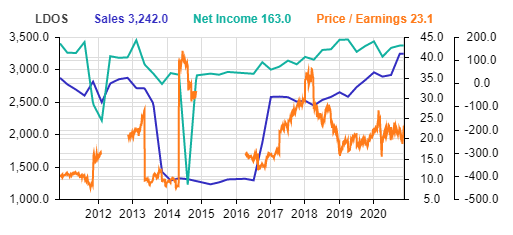
Compared against its 5-years PER band, the counter s currently trading closer to the low end, with a forecasted forward PER multiple of 15.3x vs. the current level of 23x.
The street is very positive about the counter, with 11 out of the 12 analysts covering the stock issuing a strong BUY on the counter.

Conclusion
All 5 value stocks have proven to be candidates worthy of consideration for your portfolio, with all of them outperforming the S&P 500 over the past 3, 5, and 10 years despite value counters losing favor among the investing community. Based on their historical performance investing in value stocks such as the ones highlighted above will likely generate above-market returns over the coming decade.

The table above summarizes the key financial metrics of the 5 value stocks. The table above is customized using the Stock Rover platform which is extremely flexible and allows one to select your criteria based on a pool of 500+ financial metrics to be displayed.
For those who are serious about finding a good fundamental stock screener, do check out Stock Rover. I have done a comprehensive review on the platform which you can gather more information from the article:
Stock Rover Review: The All-In-One Fundamental Stock Screener
Out of the 5 value stocks in this list, I believe that momentum is building up for both LDOS as well as ANTM.
The screenshot below shows a proprietary screening platform that I use called Traders GPS, developed by Collin Seow and his team which looks to identify stocks ready for a breakout.

ANTM has recently broken out of its all-time high level and there was a positive signal to enter at around the $332/share level which is where the stock is currently trading.

LDOS is also giving a positive buy signal at the current share price and could look to break out of its downtrend. For longer-term shareholders, these 2 value counters might be interesting candidates to consider entering now based on their improving momentum.
While it is essential to have a long-term holding horizon in mind when investing in value stocks such as the above highlighted 5 value stocks, incorporate some technical analysis such as the method demonstrated by the TGPS platform that will allow one to avoid “catching a falling knife”.
I have also done a comprehensive review of the Systematic Trading Course (which uses the in-house developed proprietary TGPS platform), voted the best investment course by Seedly which one can check out for more information on this systematic trading platform.

The Systematic Trader Program
An investing course that is voted as the Best Investing Course by Seedly reviews, the Systematic Traders Program uses the proprietary platform, TradersGPS which tells you WHAT stock to buy, WHEN to buy and HOW much to buy.
Investing in value stocks has not exactly been a “winning” proposition over the past decade or two. Only a handful of large-cap blue-chip Value stocks (based on Stock Rover’s Value Score criteria) has been able to consistently outperform the S&P 500.
There is, however, no certainty that these 5 value stocks will continue their outperformance over the coming decade. For value investors wishing to buy these value stocks with a margin of safety (MOS), one can engage in option selling, specifically, Put Selling.
Such a strategy allows one to generate income while waiting to purchase these stocks at a better price. I have written about why value investors should also be options traders to maximize one’s returns.
Do Like Me on Facebook if you enjoy reading the various investment and personal finance articles at New Academy of Finance. I do post interesting articles on FB from time to time which might not be covered here in this website.
Join our Telegram broadcast: https://t.me/gemcomm
SEE OUR OTHER WRITE-UPS
- Motley Fool review: Getting multi-bagger ideas the easy way
- Hang Seng Tech Index: A deep dive into the hottest tech stocks of Asia
- 8Best Stock Brokerage in Singapore [Update July 2020]
- Syfe Equity100 review: Does this portfolio make sense to you?
- Tiger Brokers review: Possibly the cheapest brokerage in town. Is it right for you?
- FSMOne Singapore: Step-by-step guide to open your FSMOne account and start trading
Disclosure: The accuracy of the material found in this article cannot be guaranteed. Past performance is not an assurance of future results. This article is not to be construed as a recommendation to Buy or Sell any shares or derivative products and is solely for reference only.


