
Riverstone: A beneficiary of Covid-19
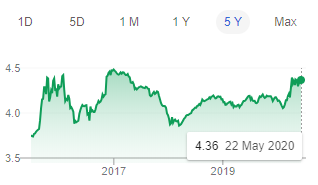
Riverstone has seen a strong appreciation in its share price in the past two months, appreciating from a low of S$0.68 back in March 2020 due to t the COVID-19 driven sell-off to a high of S$1.97 last week as the company’s stellar 1Q20 performance was well above the street’s expectations.
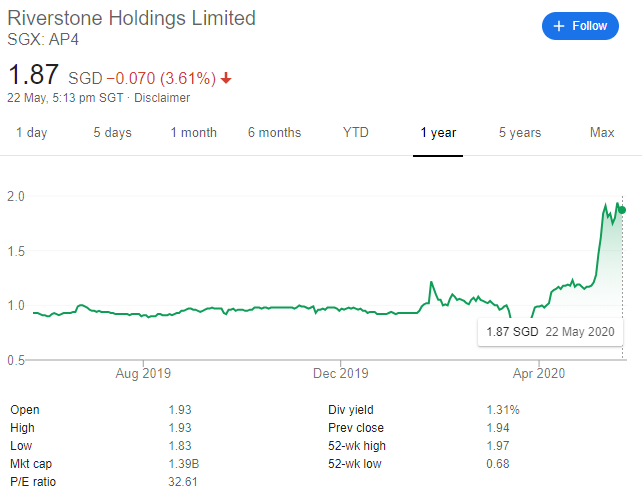
The street has rushed to upgrade the stock, with DBS now accruing a S$2.20 Target Price (TP) for the counter, UOB at S$2.15, and CIMB at S$1.86. The average TP of the three equates to S$2.07 which still represents an upside of c.11% from its last closing price of S$1.87.
Can Riverstone continue its outperformance after the strong rally of late?
I wrote about Riverstone back in Oct 2019 with a view that the counter could be witnessing an operational turnaround. I was likely too early in my positive assessment of the counter then as Riverstone’s 2019 net profit of RM$130.4m was a tad lower than my expectations of RM$139m.
The weaker-than-my-expected performance in 2H19 was due to lackluster sales growth, particularly in 4Q19 while margin improvements did not materialize as well.
Coming into 1Q20, Riverstone saw sales growth of 16% which was generally in-line with its historical volume growth. Net Profit skyrocketed from RM$30.2m in 1Q19 to RM$46.6m in 1Q20 or a 54% improvement, largely a result of Gross Profit Margin (GPM) improvement where its GPM increased by 4.6ppt on a YoY basis to 24%.
GPM improvement was largely the result of 1) a Better pricing environment for Riverstone’s products (small extent) and 2) lower raw material prices (larger extent).
For Riverstone to continue its share price appreciation on a sustainable basis, it will depend on two key factors. 1) Ability to continue driving revenue growth by double-digit both in the short and medium-term and 2) Ability to improve GPM consistently.
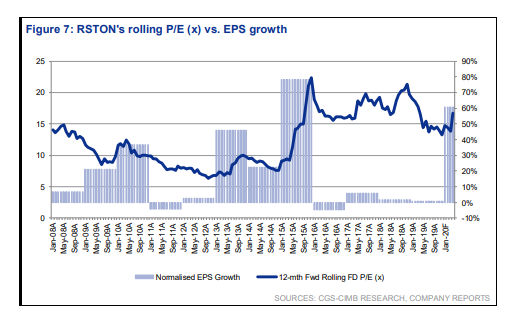
Point 2 has a lot more weighting on Riverstone operating performance and consequently share price performance. Recall that back in 2015, Riverstone’s GPM improved to 31.2% which was the highest level it has ever achieved. It’s share price appreciated from S$0.50 at the start of 2015 to a high of c.S$1.25 by end-2015.
Since 2015, GPM of the company has been on a gradual downtrend, hitting a recent low of about 20.1% in 2019. Consequently, the counter’s share price performance has been rather lackluster, hovering constantly between S$0.85 and S$1.20. This is despite a consistent improvement in its revenue generation.
A strong appreciation of its GPM ahead, possibly to the peak achieve back in 2015 will likely extend its share price outperformance in the medium term. For now, there could be short-term pullbacks on profit-taking, in my view.
Riverstone revenue growth likely to continue
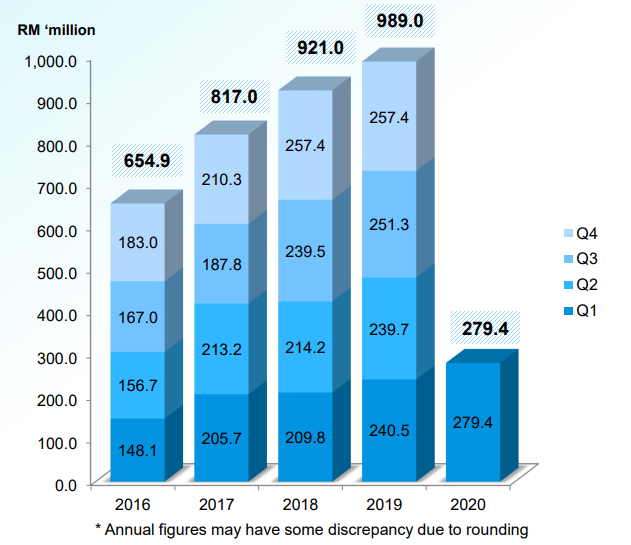
Riverstone has been growing its revenue consistently for the past decade and I expect that trend to continue both in the short-term as well as medium-term. This is from a combination of both volume growth as well as pricing improvement.
Robust order backlog due to global glove shortage (Volume growth)
According to management, the counter is now running at a c.95% utilization rate to fulfill orders vs. historical utilization rate around 85-90%. The COVID-19 pandemic has resulted in a surge for glove demand both from existing customers as well as new demand coming in from other sectors due to the heightened emphasis on hygiene.
Healthcare Gloves
Based on management’s guidance, the order backlog for healthcare glove has now extended to 6 months vs. prior level of c.3 months. This could potentially further extend. According to Top Glove’s management, lead time for their products has been extended to 1-year.
This provides a substantial amount of forwarding revenue visibility for this segment. However, due to Riverstone’s plants already operating at full capacity (95%), a substantial improvement in revenue volume growth for healthcare gloves can only materialize from capacity improvement.
Cleanroom Gloves
Riverstone’s Cleanroom gloves segment experienced resilient volume sales growth of 20% YoY in 1Q20 with corresponding revenue growth of 17%. This was due to strong demand from the hard disk drive, semiconductor and pharmaceutical industries.
We might see management prioritizing the Cleanroom glove segment over the Healthcare glove segment (due to higher margins from the latter) in the medium-term post-COVID-19. This should result in Riverstone’s Cleanroom glove capacity increasing ahead, with the Cleanroom glove segment accounting for a larger % of Group’s revenue from the current level of 26%.
On track to meet capacity expansion (Volume growth)
Phase 6 of Riverstone’s expansion plan is on track to lift capacity by up to 1.4bn to a total of 10.4bn pieces of gloves/annum. Out of a total of 7 lines, two are already in production, and the remaining lines are expected to be ready by end-2020.
Moving beyond phase 6, plans are underway for Phase 7-8 following the group’s acquisition of a 3.8-acre land bank in Taiping where Riverstone intends to construct its new facility and expand capacity further.
Average Selling Price (ASP) to see improvement in 2Q20 onwards (Pricing growth)
The average selling price (ASP) increase for the healthcare segment only materializes in May, thus 1Q20 did not benefit from any ASP rise. The cleanroom segment is less affected by the volatility in ASP as it is locked in via contracts.
From May onwards, healthcare glove ASP is set to increase by 10% for existing customers and 20% for new customers.
Riverstone margins might have finally bottomed in 2019
I highlighted earlier that Riverstone’s Gross Profit Margins (GPM) hit a low of 20.1% in 2019. This is mainly due to the rise in its raw material costs. The tide might finally turn in 2020. Recall that back in 2015, Riverstone’s margin appreciated strongly due to the confluence of favorable currency, lower raw material prices, and greater economies of scale. We are seeing that happening in 2020 again.
Falling Butadiene prices
Riverstone has benefitted from the down-trending prices of Butadiene, a key raw material used in the production of its nitrile-based gloves. Butadiene price, which tends to move in tandem with oil prices, is down c.33% in 1Q20. This has a huge impact on Riverstone’s gross margins since this raw material alone accounts for c.50% of Riverstone’s COGS.
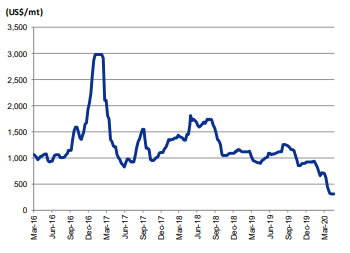
Further oil price weakness should continue to support Riverstone’s gross margins in the form of lower COGS.
Strong USD vs. MYR
Riverstone’s revenue is denominated in USD while costs are mostly in MYR. Hence, the strengthening of the USD against the MYR tends to be beneficial to Riverstone in terms of GPM improvement.
USD has strengthened significantly against MYR in recent months. That trend might continue amid a flight to safe currencies such as the USD. MYR strength tends to trend alongside improvement in oil prices. If the oil price remains weak due to weak global demand, we should expect MYR weakness to continue.
ASP Increase + raw material decrease = strong margins
Historically, Riverstone passes on any cost savings from lower raw material prices to its customers using a cost-plus model for its healthcare gloves.
However, due to the skew in demand-supply dynamics hugely favoring manufacturers based on current circumstances, Riverstone has raised prices between 10-20% for its healthcare glove products while concurrently benefitting from a substantial decline in raw material costs.
The potent combination of higher selling prices alongside lower COGS will lead to a substantial improvement in margins. Note that Riverstone saw a 4.6ppt YoY improvement in 1Q20 GPM when the effect of the price hike (only happens in May 2020) has not yet been accounted for.
Taking into account the price hike for 2Q20, we should expect a strong GPM improvement for 2Q20 and potentially into 2H20 as well. This is unless its costs start creeping higher.
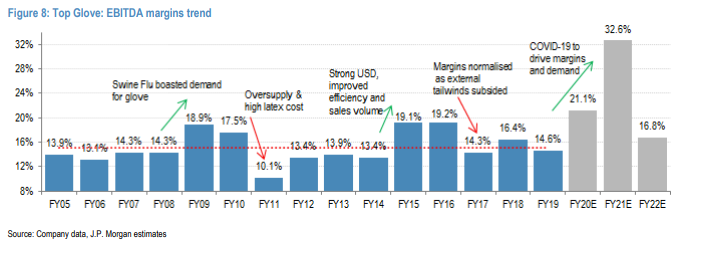
JPM has evaluated the historical EBITDA margin performance of Top Glove in the chart below. The brokerage house expects EBITDA margin for Top Glove to accelerate significantly from 14.6% in 2019 to 21.1% in 2020 and 32.6% in 2021. The highest EBITDA margin secured before 2020 was back in 2015/16 which was similar to the level that Riverstone achieved its highest GPM of 31%.
If JPM’s forecast for Top Glove’s operating performance can be translated to that of Riverstone’s operating performance, there might be a possibility for Riverstone’s GPM to hit 31% this year on the back of both demand and margins improvement. This is however just one reference point and the operational dynamics of Top Glove might not be representative of that of Riverstone.
DBS is forecasting Riverstone’s GPM to an average of 24.5% in 2020. CIMB is forecasting GPM at 26.6% and UOB is forecasting GPM at 23.9%. The street 2020 forecast seems a tad conservative, considering that Riverstone has already managed to achieve a GPM of 24% in its 1Q20 results and there could be more operating leverage ahead.
Based on my internal forecast, there is a possibility that Riverstone’s GPM could hit the 29% level on the full year 2020 basis driven not by its Cleanroom Glove segment, but its Healthcare Glove segment.
Financial Forecast
I assume that Riverstone 2020 revenue could potentially hit RM$1.29bn in 2020. To generate this revenue figure, I need to make assumptions on the individual segments volume and ASP.
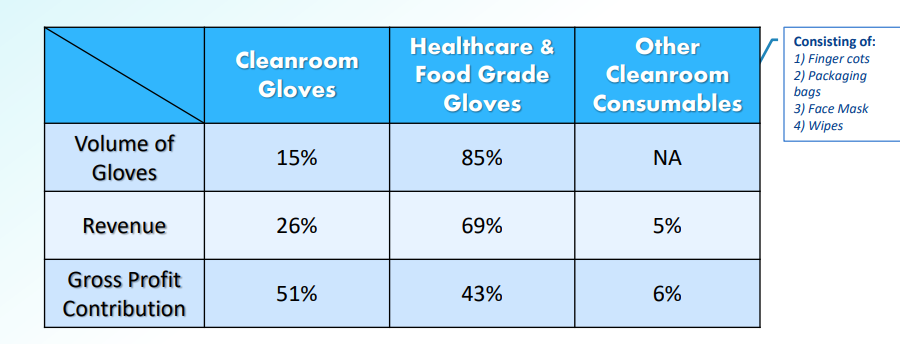
Management has provided clues that Cleanroom Gloves currently encompass 15% of volume, 26% of revenue, and 51% of Gross Profit while Healthcare Gloves encompass 85% of volume, 69% of revenue, and 43% of Gross Profit.
Step 1: Breaking down 1Q20 segmental revenue and Gross profits


Using those figures, I can extrapolate what 1Q20 Cleanroom/Healthcare revenue and Gross profits might be.
Step 2: Figure out a rough approximation of Cleanroom and Healthcare Glove production in 1Q20
I look to figure out what the segmental production units might be based on:
Revenue = Price * Volume
We have already derived the revenue figure. To get the pricing and volume, I used DBS Vickers historical reported figures for 2018 and 2019. Note that the latest 2019 figure corresponds to a cleanroom glove production volume of 15% of the Group’s total volume and healthcare glove production volume is 85%.

I generated the individual product unit selling price by dividing the revenue by volume. For 2019, we see that the Cleanroom Glove unit selling price is RM0.207 while Healthcare Glove unit selling price is RM0.097

I assume that for 1Q20, there is no change in ASP for the individual products as guided by management.
Using the same USP, I forecast the respective unit productions:
Volume = Revenue / Price
I assume that Riverstone produced 350m units of Cleanroom gloves and close to 2bn units of Healthcare Gloves in 1Q20.
Step 3: Forecast growth in Volume and ASP to generate segmental revenue
With the volume figures for 1Q20, I assume a QoQ volume growth rate of 5% for Cleanroom Glove and 3% for Healthcare Glove. This translates to a total Cleanroom Glove production of 1.5bn units for 2020 and 8.3bn units for Healthcare Glove. Total Glove production is 9.8bn. With a capacity of 10.4bn, which equates to a utilization rate of 95%.

For the USP assumption, I assume that 1Q20 saw zero USP increment due to product demand (see next section). In 2Q20 and beyond, Cleanroom glove USP remains constant while Healthcare Glove USP increases by 8% in 2Q20 and a further 7% in 3Q20. This is based on management guidance that healthcare glove ASP increases by 10% for existing clients and 20% for new clients. Given that the increases happen only in May, I moderated the overall 2Q20 increment to only 8% with 3Q20 at 7% to be conservative.

With both volume and USP figures, I can derive the individual segment revenue.
Step 4: Deriving the gross profit and GPM of each segment
Next comes the tricky part. To derive the GPM for 2Q20 and beyond, I break down the products into their unit cost.

Since I have the gross profits of each segment alongside its revenue and volume, I can calculate its cost/unit.
Generally, USP/ASP will trend in the same direction as the unit cost. However, in 1Q20, we start to see a divergent where cleanroom unit cost declines to RM0.11 from RM0.125 in 2019 while we assume flat USP. We see the same trend for Healthcare Glove.
This is due to significantly low input cost, in this case butadiene that has driven the COGS of each product down significantly.
USP is not expected to decline due to strong product demand. We assume that the cost/unit remains constant for both products for the remainder of 2020.
Base on this assumption, we can calculate the actual COGS of each product:
COGS = Unit cost * Volume

This is where operating leverage starts to show for the healthcare glove segment.
We have previously derived the segmental revenue in Step 3. By subtracting segmental revenue from the segmental COGS, we derived the Gross profit of each segment.


We see a huge jump in the GPM of healthcare gloves due to the combined operating effect of higher USP and constant unit cost.
This will ultimately translate to a Group Gross Profit of RM$367m for 2020, translating to a GPM of 29.2% which is significantly higher than what the street is currently forecasting.
Step 5: Deriving Net profit
Riverstone incurred operating expenses of c.RM$9m in 1Q20. I assume a full-year operating expense level of RM$50m to be conservative.
Consequently, Profit before tax for 2020 is expected to be around RM317m. I assume a full-year tax rate of 20%. This will result in a net profit of RM253m which is almost double 2019 level of RM130m
Valuation
Based on a forecasted net profit level of RM253m for 2020, that will imply that Riverstone is trading at a forward 2020 PER multiple of 16.8x.
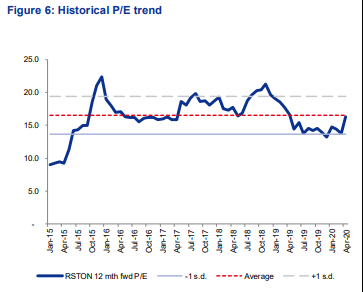
This is probably in-line with its historical past 5-year average PER multiple of 17x according to CIMB. However, there is a potential for Riverstone to re-rate to 22x forward PER based on its growth potential which happens back in 2015 when the company exhibited strong earnings growth.
A 22x forward 2020 PER multiple might imply a fair value target price of RM$2.44/share for Riverstone, based on my 2020 EPS forecast.
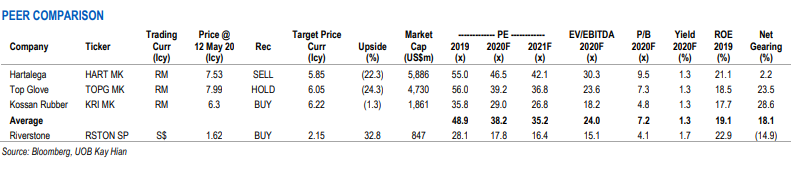
According to UOB, larger glove peers in Malaysia are trading at a forward 2020 PER multiple of 38.2x. However, Riverstone has historically been trading at c.38% multiple discounts to these larger glove players. Assuming the same discount holds, that will imply a fair value multiple of c.23.7x which is fairly close to our assigned multiple of 22x.
Moving Forward
One needs to recognize that Riverstone is ultimately a commodity play and is a price taker for its products. In normal circumstances, the company will have to past on cost savings to its clients.
It is only in this extraordinary situation where Riverstone’s pricing power remains robust due to strong product demand while the company benefits from a low oil price environment.
I believe there could be positive earnings surprises ahead which could further re-rate the counter when the street raises their EPS expectations.
Riverstone has shown fairly good execution when it comes to increasing capacity and growing its revenue. However, will we see a repeat of 2015 where GPM peaks at 31% and subsequently declines to 20% over the next 4 years?
Once the initial tailwind of a higher ASP and lower COGS fades away, Riverstone might again see history repeats itself. That might however still be a year away.
What Riverstone might be looking to achieve is to gradually veer its product mix to the higher-margin cleanroom glove, although this segment is more cyclical. When it comes to cost, beyond the impact of rising oil prices translating to higher Butadiene costs, what the company can achieve is to increase its automation efforts and reduce the reliance of manpower.
Conclusion
Riverstone has been a well-run company and I will be a buyer of the stock on dips. The price has run up very steeply over the past couple of weeks and there might be profit-taking in the short term, resulting in a stock pull-back.
While I usually avoid commodity players, Riverstone might be a good hedge against the second wave of COVID-19 pandemic that will likely see demand for its healthcare glove appreciate further.
Given the consistency in terms of top-line generation as well as the fact that they are the market leader in cleanroom gloves production which should be increasingly sought after in the next wave of 5G driven semi-conductor proliferation, Riverstone might see its valuation being re-rated alongside larger peers.
While profit-taking might be on the horizon, I believe the longer-term outlook for Riverstone is still a positive one.
Do Like Me on Facebook if you enjoy reading the various investment and personal finance articles at New Academy of Finance. I do post interesting articles on FB from time to time which might not be covered here in this website.
Join our Telegram broadcast: https://t.me/gemcomm
SEE OUR OTHER WRITE-UPS
- WHY I AM STILL BUYING REITS EVEN WHEN THEY LOOK EXPENSIVE
- TOP 10 FOOD & BEVERAGE BRANDS. ARE THEY WORTHY RECESSION-PROOF STOCKS?
- THE BEST PREDICTOR OF STOCK PRICE PERFORMANCE, ACCORDING TO MORGAN STANLEY
- TOP 10 HOTTEST STOCKS THAT SUPER-INVESTORS ARE BUYING
- SEMBCORP MARINE 3Q19 LOSSES BALLOONED TO S$53M. WHAT YOU SHOULD KNOW
- VENTURE 6% PRICE DECLINE POST-RESULTS; SATS’ 2QFY20 COULD REMAIN WEAK
Disclosure: The accuracy of the material found in this article cannot be guaranteed. Past performance is not an assurance of future results. This article is not to be construed as a recommendation to Buy or Sell any shares or derivative products and is solely for reference only.


2 thoughts on “Riverstone: Can the share outperformance continue?”
You made some decent factors there. I appeared on the internet for the difficulty and found most people will go together with together with your website.