
According to Barron’s, Morgan Stanley recently put together a team of quantitative strategies to work, determining which stock signals have tended to best predict stock price performance over time.
In this article, we highlight what this stock signal is and using a combination of screening criteria linked to this signal, we derived a list of 14 S&P 500 stocks and 9 SGX stocks that currently fit these criteria. Read on to find out more.
Is value investing dead?
The team looked at 4,000 stocks going back to 1997, because that’s about what high quality data first became available. They looked at factors such as Price/Earnings ratios, revenue growth, leverage and share price momentum, a grand total of 81 screening criteria.
A key takeaway: Do not give up on value stocks. However, consider a different way you look at them. If a company has a decent dividend yield, that will be a welcome sign as investors are being paid to wait for a company’s “intrinsic value” to be realised by Mr Market. A better signal will be total capital return, which includes both dividends and stock buybacks.
Value investing, as a strategy has under-performed over the past few years. Look at Warren Buffett’s Berkshire Hathaway that has under-performed the S&P500 Index for quite a while now. That left many investors wondering if value investing as a strategy is dead.
However, according to the research, over a relatively long period of time, in this case 22 years, value factors still beat growth factors.
More critically, an alternative measure of value based on free cash flow rather than earnings has done much better, trouncing a composite of growth factors and other value factors over the past 5 years and 22 years.
Free Cash Flow is the money that a company collects after paying for big-ticket investments, typically termed as their capital expenditure or capex for short.
Free Cash Flow = Operating Cash Flow – Capex
Some believe this is a better measure of earnings, where earnings are more easily manipulated based on accounting rules and management’s assumptions. Free cash flow is generally more difficult to manipulate. It is the excess money a company generates which can be channelled towards dividend payments as well as share buy backs.
Best Stock Price Predictor
Worldwide, a portfolio that bought stocks with the lowest P/Es and bet against those with the highest ones beat the market by an annualised 4.4 percentage points (ppt) over the past 22 years but just 0.8 ppt over the past 5 years.
The best stock price predictor was Free Cash Flow divided by Enterprise Value (where enterprise value is defined as a company’s market capitalisation adjusted for the company’s cash and debt)
This measure beat the market by 8.3 ppt over the past 22 years and 3.7 ppt over the past 5. This compared much favourably to growth factors which beat the market by barely anything over the past 22 years and less than 1 ppt over the past 5.
Separately, according to the report, a company’s yield which incorporates both dividend payments as well as share buy backs predicted better performance than one based on dividends alone.

US Stocks
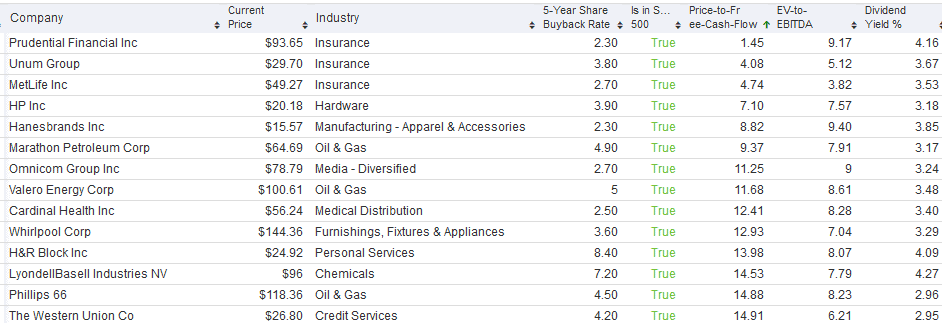
So based on this article, we created our own screening criteria which incorporated these factors for the S&P 500 counters:
- Price/Free Cash Flow Multiple < 15x
- EV to EBITDA < 10x
- Dividend Yield > 2.9%
- 5 Year annualised share buy-back > 2%
- Exclude the Retail (Cyclical) Industry
Our screener churned out a list of 14 S&P 500 stocks that met these criteria at present
We did a little back-testing on our own for this strategy but with limited data availability. If you have bought names that fulfilled these criteria at the start of 2019, such a strategy would have beaten the S&P500 index by 4ppt in 2019.

However, it is definitely inconclusive to base a back-testing result just on a single year performance.
SGX Stocks
We also did a screening for the SGX market based on these criteria
- Price/Free Cash Flow Multiple < 15x
- EV to EBITDA < 10x
- Dividend Yield > 3.1%
- Return on Invested Capital > 15%
We excluded the share buyback criteria as companies in these countries do not have the culture of aggressive share buy-back. Instead more focus is on the payment of dividend. We included an additional Return on Invested Capital metric or ROIC for short, with a minimum base ratio of 15%. This is a ratio that measures the efficiency of a company at allocating the capital under its control to profitable investments.
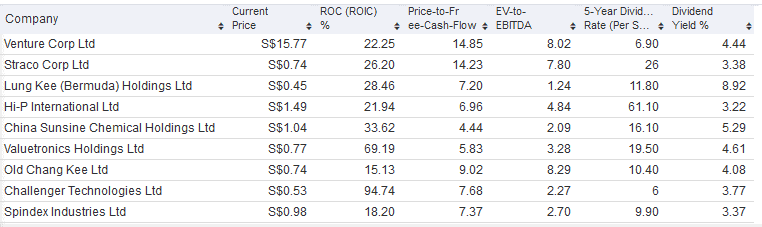
The screener threw out a list of pretty interesting small-mid cap names such as Straco Corp, Valuetronics and in the big-cap space for SGX, we have Venture Corp.
If we are to expand our coverage beyond Singapore and into HK, we can find bigger cap names such as China Vanke, Country Garden etc that fits these criteria.
Conclusion
Many people are still out there searching for THE Holy Grail criteria when it comes to investing. There really isn’t a perfect screening criterion in my opinion and when it boils down to active stock selection, one will need to put in the necessary hard work and time to learn and understand the company in question.
Using a free cash flow type screener typically requires a longer time frame for the outperformance to materialise, in my opinion. In the meantime, one is paid a dividend to wait, which at > 3%/annum, is a decent return compared to most low-yielding “safer” investment products.
Do Like Me on Facebook if you enjoy reading the various investment and personal finance articles at New Academy of Finance. I do post interesting articles on FB from time to time which might not be covered here in this website.
Join our whatsapp broadcast: txt hello to https://api.whatsapp.com/send?phone=6587407951&text=&source=&data=
SEE OUR OTHER STOCKS WRITE-UP
- TOP 10 HOTTEST STOCKS THAT SUPER-INVESTORS ARE BUYING
- SEMBCORP MARINE 3Q19 LOSSES BALLOONED TO S$53M. WHAT YOU SHOULD KNOW
- VENTURE 6% PRICE DECLINE POST-RESULTS; SATS’ 2QFY20 COULD REMAIN WEAK
- YANGZIJIANG’S SHARE PRICE IS UP 7%. CAN MOMENTUM PERSIST POST-RESULTS ON 7TH?
- SINGAPORE AIRLINES 2QFY20 PREVIEW. HERE IS WHAT TO EXPECT.
- HOW TO PLAY THE PARTIAL OFFER FOR KEPPEL?
Disclosure: The accuracy of material found in this article cannot be guaranteed. Past performance is not an assurance of future results. This article is not to be construed as a recommendation to Buy or Sell any shares or derivative products and is solely for reference only.


5 thoughts on “The best predictor of stock price performance”