Ultimate guide to Dividend Investing
This is a comprehensive step-by-step guide on how to invest in dividend stocks, which I believe will be very useful for a beginner investor who wishes to know all about dividend investing.
Why are dividends important when it comes to outperforming the market, how exactly to invest in dividend stocks, what are the key financial ratios to be aware of when partaking in dividend investing, how to use a simple valuation method to find the fair value of dividend stocks, how to structure your own dividend portfolio and much more.
This comprehensive guide is broken down into 5 Chapters.
Chapter 1: Getting Started
Chapter 2: Basics of Dividends
Chapter 3: What makes a good Dividend Stock?
Chapter 4: Where to find good Dividend Stocks and how to value them
Chapter 5: How to build a Dividend Portfolio
So without further ado, let’s get started.
Chapter 1: Getting started
The investment strategy that keeps giving
What if there is an investment strategy that could provide you with a secure stream of cash, FOR LIFE! If there is an investment strategy that allows you to live off 4-5% of your portfolio each year without having to sell your shares, would you be interested? Not only that, but your income stream can also grow by 5-10% each year, thus beating the negative impact of inflation.
Sounds like the Ideal Retirement asset to own?
What if this strategy also has a strong track record of not only being less volatile than the S&P500 index but also consistently outperforming it?
This is not a PONZI scheme. It is just plain old dividend investing or investing in dividend-paying stocks. While it might not seem like there is anything special about investing in companies that pay dividends, their performance numbers will blow you away. Dividend-paying stocks are like the Volvos of the investing world. They are not fancy, but they have a lot going for them when you look deeper under the hood.
According to research done by the Hartford Funds, dividends have played a significant role in the returns of investors during the past 50 years. Going back to 1970, 78% of the total return of the S&P500 index can be attributed to reinvested dividends and the power of compounding.
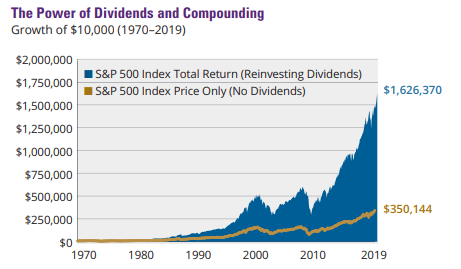
One can build a dividend-stock portfolio that generates an annualized yield of 4-5% and this yield can be growing at a rate of 5-10% each year by investing in a special “breed” of dividend-paying stocks called “The Dividend Growers”. These are stocks that have a consistent track record of growing their dividend payments annually by x%. The best of the best is termed as the “Dividend Kings”. These are stocks that grew their dividends every single year for the past 50 years and counting. The next class is the “Dividend Aristocrats”, stocks that have a track record of growing their dividend payments annually over the past 25 years.
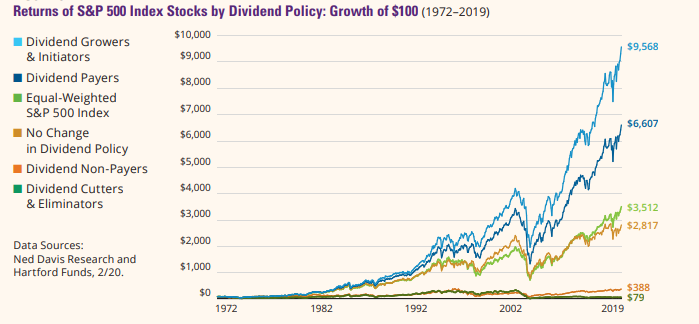
If done correctly, dividend investing offers a combo of income generation as well as “growth” investing. You get income from the dividend payments while at the same time benefit from the capital appreciation of these dividend-paying stocks, as illustrated by the diagram below which shows the “best of the best”, ie the Dividend Growers & Initiators significantly outperforming the equal-weighted S&P500 index over the past 5 decades.
With a portfolio consisting of strong dividend-paying stocks, one can potentially achieve financial independence early. This does not necessarily mean retirement. You may never want to retire but just having the freedom and flexibility to work part-time or take a job that you are truly passionate about that doesn’t pay well, or just giving back to society through social work.
A better “retirement” solution
From the angle of retirement, won’t it be fantastic if the capital that you invest in dividend-paying stocks will ensure that you never run out of money? While a portfolio of dividend stocks will experience some variability in market value (vs. a portfolio of bonds), the income that a good dividend portfolio churns out should consistently grow over time.
Even during the latest COVID-19 driven pandemic, there are many companies that increase their dividend payment. At present, there are a total of 65 companies that are still listed as Dividend Aristocrats. (Note: Ross Stores (ROST) which was added to the Dividend Aristocrat list in Jan 2020 announced that it is suspending its dividend on May 21, 2020).
Instead of systematically withdrawing aka selling from a portfolio every month to fund one’s retirement expenses, a dividend investor can choose to fund his/her expenses through dividends. Which situation sounds more stressful for you: 1. An investor who lives off the dividends distributed by his investments each month or 2. The investor who needs to decide which asset to sell to generate enough cash flow to maintain the expenses each month?
Living on dividend income in retirement provides cash without incurring the stress of figuring out which assets to sell and more importantly the timing to sell them. In a severe market correction, the last thing you want to do is to liquidate your investment assets at rock bottom prices. However, that might be the dilemma a retiree would have to face, one who is banking on the gradual liquidation of his/her stock portfolio to fund their retirement expenses.
Without additional income sources from dividends, they will be “selling their portfolio on the low”, an unfortunate scenario that might ultimately derail their retirement plans.
Regardless of what specific goals you might have in mind, dividend investing can potentially help you achieve them, FASTER. Before we go into the details of what dividends are and all the nitty-gritty details, let me provide you with a quick illustration of how a portfolio of dividend growth stocks can help you achieve your “retirement” goal.
How to earn $100k+ in retirement
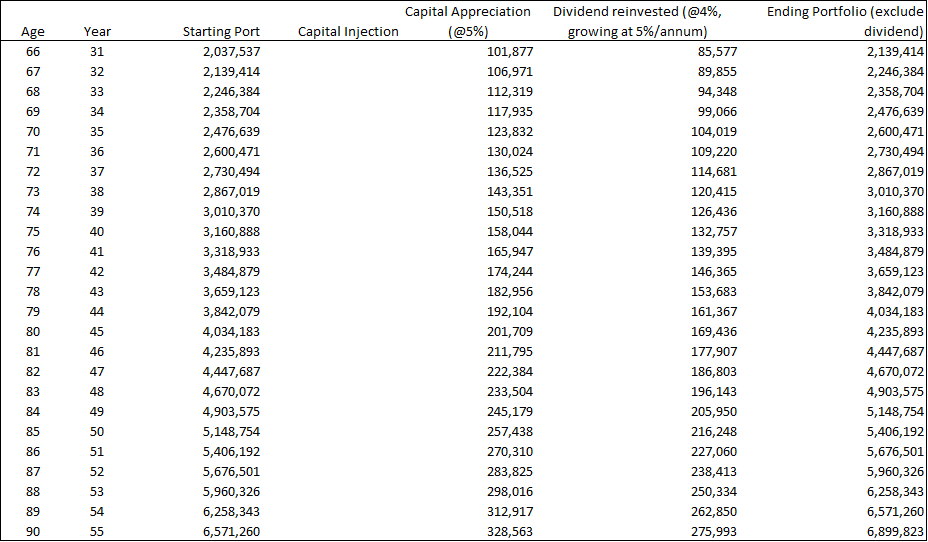
Let’s say you are 35 years old, happily married with two kids. However, you have never got around to saving for retirement until now. You and your spouse decide it is time to act and both of you commit to saving $500 each per month into a portfolio of dividend-paying stocks that generates a yield of 4%/annum, growing at a rate of 7% each year.
You assume that this portfolio will generate a market return of 5%. In addition to the 4% yield which you intend to re-invest, your total return a year is approx. 9%. Starting with a portfolio of $12,000 in the first year, your combined portfolio will grow to $2.04m by Year 30 (Age 65).
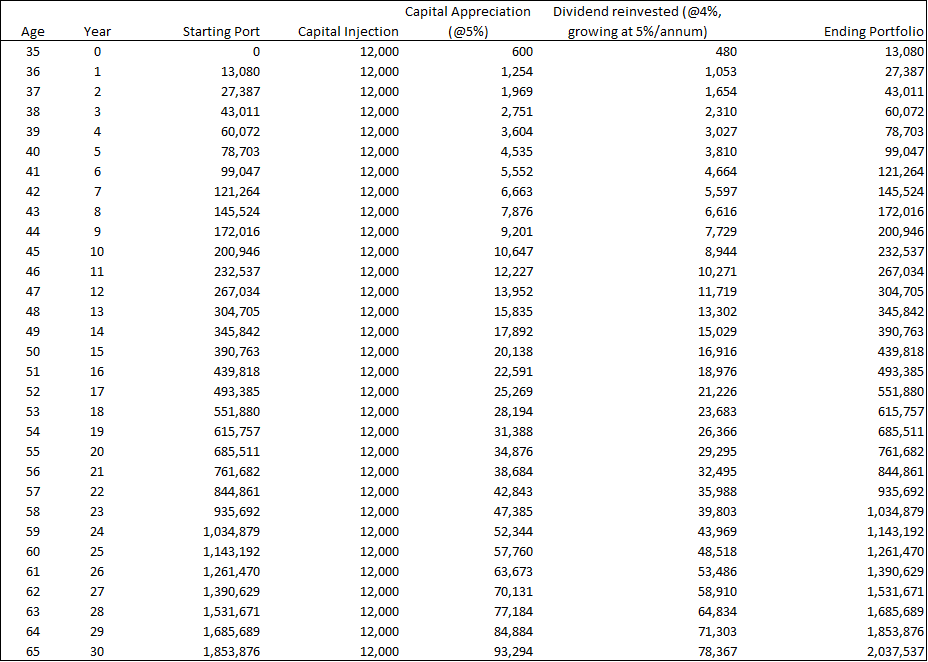
Just for comparison sake, investing in a portfolio that pays 0% yield (vs. 4% in our above illustration, growing at 5% annually) will generate an ending portfolio value of just $891k.
Assuming that at Age 65, you stop your annual contribution of $12k and start using your dividend payments to fund your retirement expenses, you will have approx. $85k at Age 66, with your dividend amount growing by 3x by the time you hit Age 90 to $276k/ annum.
So now that I have gotten your attention on the attractiveness of Dividend Investing, let us start our dividend discussion by explaining the basics of Dividends. For those who are already familiar with what exactly dividends are and the type of companies that typically pays a dividend, you can skip right to Chapter 3 which identifies how to select good dividend stocks.
Chapter 2: Basics of Dividends
What are dividends?
A dividend is the distribution of some of a company’s earnings to its shareholders. For example, Company ABC makes some profits in a particular year, ie generates positive net profit. The management and the board of directors believe that they do not need ALL the net profit to be reinvested back into the company for growth.
Hence they decided to take a portion of the profits and return to shareholders in the form of dividends. Hence, dividends can be seen as a “reward” for shareholders for putting their money into the company. When the company makes money, shareholders are “rewarded”.
Dividend-paying companies are typically those whose operations are in the “stable” phase vs. “growth” phase. The former does not need to reinvest the bulk of the profits generated back into the company to stimulate further growth since their products/services are already pretty well-known. Growth companies typically do not pay dividends as they will be re-investing whatever profits being generated back into the company in-lieu to further “stimulate” growth.
An example of a well-known Dividend paying company is McDonald’s, a household name that has not just been paying but has also been growing its dividends since 1976 which represents 43 years of consecutive dividend growth. This is a company that is on track to becoming a Dividend King, the highest accolade given to a dividend-paying company, one who has at least 50 years of dividend growth record.
More on dividend-paying companies later.
Types of Dividends
There are 3 key types of dividends:
Cash dividends: A cash dividend is a payment made by a company out of its earnings to investors in the form of cash. This transfer economic value from the company to the shareholders instead of the company using the money for operations.
When a company issues a cash dividend, typically every quarter for most US dividend-paying companies, the share price will drop by roughly the same amount as the dividend on the ex-dividend date. This is the result of the economic value transfer.
Another consequence of cash dividend is that receivers of cash dividends mist pay tax on the value of the distribution, lowering its final value. For example, there is a 30% Dividend Withholding tax for Singaporean investors buying US dividend stocks. Therefore a 5% yielding stock will net just 3.5% for a Singaporean investor.
For a Singaporean investor, dividends from Singapore companies listed on the Singapore Stock Exchange are not taxable.
Stock dividends: A stock dividend, sometimes also termed as a scrip dividend, is an increase in the number of shares of a company with the new shares being given to shareholders. Companies may decide to distribute this type of dividend to shareholders if cash liquidity is a concern.
If a company were to issue a 5% stock dividend, this will mean that outstanding shares in the company will increase by 5%. If there are 1m shares in the company, there will now be an additional 50k share. For every 100 shares that you own, you will be entitled to 5 more shares.
A shareholder can choose to “cash-out” of the stock dividends by selling the additional shares or choose to keep the shares and hope that the company can generate a better rate of return using the cash conserved from dividend payments and subsequently re-invested in higher ROI projects.
Special dividends: A special dividend is a form of dividend that is paid on an “ad-hoc” basis and not typically recurring in nature. These are dividend payments that are given out on top of the usual “recurring” payments.
Special dividends are typically issued after a really strong set of financial performance which could be one-off. For example, a tech company could have sold a property (non-core business) and realized an exceptional profit in a particular year. If there is no planned usage for the additional cash derived from the sale of the property, management can choose to return the cash to shareholders in the form of a special dividend.
Companies that have a huge cash hoard on their balance sheet which they have no immediate use for can choose to also return their capital hoard to shareholders in the form of special dividends.
Dates associated with Dividends
Announcement Date: This is the date that the company’s board of directors announced when the company will pay a dividend. This date is not very important.
Cum-dividend Dates: This will be the period in which a shareholder of the company will be entitled to the dividend payment. If you buy a stock when it is trading cum-dividend, you will be entitled to the dividend payment. The last date when the stock trades “cum-dividend” is the most critical. This is when the stock will be trading “ex-dividend” the NEXT DAY.
Ex-dividend date: This is the date where if you purchase the stock, you will no longer be entitled to the dividend amount. This date will also be when the price of the stock will typically fall by the dividend amount. For example, if a stock closes at $50 on the last day of cum-dividend (20 April). It previously announced a dividend payment of $0.50. On the ex-dividend date (21 April), the price will immediately drop to $49.50.
For a shareholder of the stock on the close of 20 April, he can choose to sell the stock on 21 April and still be entitled to the $0.50 dividend payment.
Record Date: This the date that the company looks at its records to see who the shareholders are. This date usually occurs 1 business day after the ex-dividend date. To be eligible for the dividend, you must buy the stock at least 2 business days before the record date. Using the example above:
20 April: Cum-dividend
21 April: Ex-dividend
22 April: Record date
Pay Date: The date that the dividend is paid. Straight forward enough.
Types of Dividend stocks
When we talk about dividend stocks, we generally refer to established blue-chip companies such as General Electric, McDonald’s, Coca-cola, etc. There are many different types of dividend-paying companies that operate in different industries. We will outline some of the major industries of dividend-paying stocks and the respective Dividend Aristocrats (companies that demonstrated 25 years of continual dividend growth) in those industries.
Consumer Staples
These are companies that sell products which consumers use on a day-to-day basis, items such as beverages, household products, personal care products, etc. Consumer staple companies sell products that are non-cyclical, meaning that consumers still generally need to buy their products, recession, or no recession.
As a result, these companies tend to have relatively consistent earnings and cash flow which allows them to pay a consistent dividend amount every single year.
Dividend Aristocrats in this category include:
- Archer Daniels Midland (ADM)
- Amcor (AMCR)
- Brown Forman (BF-B)
- Colgate Palmolive (CL)
- Clorox (CLX)
- Coca-Cola (KO)
- Hormel Foods (HRL)
- Kimberly Clark (KMB)
- McCormick & Company (MKC)
- PepsiCo (PEP)
- Procter & Gamble (PG)
- Sysco Corporation (SYY)
- Wal-mart (WMT)
- Walgreen Boots Alliance (WBA)
Industrials
The industrial sector is the section of the overall stock market that is concerned with manufacturing, producing, and distributing goods that are used in construction and manufacturing. The sector also includes other industries like airlines, farming equipment, metal fabrication, industrial machinery, lumber production, and metal fabrication.
Because of the nature of the businesses it contains, the performance of the industrial sector is primarily driven by the supply and demand for building construction – including residential, commercial, and industrial properties. The sector’s performance also fluctuates in response to changes in the supply and demand for manufactured products.
This means that the industrial sector is more cyclical than, say, the healthcare sector or the consumer staples sector. This is because when the economy contracts and consumers begin saving more and spending less, construction slows and industrial companies must produce fewer goods – which reduces sales. Even many of the best industrial sector stocks experience cyclicality.
Some of the industrial stocks that are suffering right now are oil and gas-related industrial companies as well as those exposed to the aerospace sector. There are however many other industrial-type companies that have shown operational resilience amid COVID-19 and have continued to pay higher dividends amid the current recession.
Dividend Aristocrats in this category include:
- A.O.Smith (AOS)
- Cintas (CTAS)
- Dover (DOV)
- Emerson Electric (EMR)
- Expeditors International (EXPD)
- Illinois Tool Works (ITW)
- 3M (MMM)
- Pentair (PNR)
- Roper Technologies (ROP)
- Stanley Black & Decker (SWK)
- W.W. Grainger (GWW)
- General Dynamics (GD)
- Caterpillar (CAT)
- Raytheon Technologies (RTX)
- Otis Worldwide (OTIS)
- Carrier Global (CARR)
Healthcare
The healthcare sector is home to some of the most popular dividend stocks in our investment universe. The importance of healthcare in the lives of many consumers makes this sector one of the most stable and recession-resistant in the entire stock market and allows well-managed healthcare companies to raise their dividends year in and year out.
There are several fundamental reasons why healthcare stocks are appealing for self-directed investors. First of all, healthcare stocks are extraordinarily recession-resistant.
This makes sense. Consumers are far less likely to reduce their healthcare expenditures than they are for more discretionary expenses like telecommunications, clothing, or even utilities. The only sector that comes close to healthcare in terms of recession resiliency is the consumer staples sector.
Investors should keep in mind that not all healthcare companies are created equal. Like all sectors, it has various subsectors, including:
- Medical devices – Medtronic (MDT) is an example
- Pure-play pharmaceutical companies – Teva (TEVA) is an example
- Drug distribution companies – McKesson (MCK), Cardinal Health, and AmerisourceBergen (ABC) hold the lion’s share
- Healthcare conglomerates – Johnson & Johnson is the best example
Dividend Aristocrats in this category include:
- Abbott Laboratories (ABT)
- Abbvie (ABBV)
- Becton, Dickinson & Company (BDX)
- Cardinal Health (CAH)
- Johnson & Johnson (JNJ)
- Medtronic (MDT)
Consumer Discretionary
Consumer Discretionary, or also termed as consumer cyclical stocks, are companies which produce goods and services that are considered non-essential by the average consumer.
The consumer discretionary sector is highly varied. It includes the following industries (among others):
- Casinos
- Cruise lines
- Most restaurants
- Department Stores
- Apparel companies
- Auto parts retailers
- Entertainment companies
The non-essential business models of these companies mean that their financial performance is highly reliant on the state of the overall economy. When times are good, consumer cyclical stocks will perform very well; conversely, recessions will cause consumer cyclical stocks to perform worse than their consumer staples counterparts.
The COVID situation has significantly impacted consumer discretionary stocks, even heavyweights such as Disney have to suspend their dividends as their core operations (parks and entertainments) got hit badly due to travel restrictions in place.
The worst-hit are of course the cruise companies and casinos.
Dividend Aristocrats in this category include:
- Genuine Parts Company (GPC)
- Leggett & Platt (LEG)
- Lowe’s Companies (LOW)
- McDonald’s (MCD)
- Target (TGT)
- V.F. Corporation (VFC)
Financials
There are several large and established financial institutions that are also consistent dividend payers. These are not your banks but are mainly well-run insurance companies, asset management firms, financial services companies, etc.
Banks, which used to be fantastic dividend payers, offering yields between 3-5% before the GFC, all had to dramatically cut their dividend payments when falling asset prices wreaked havoc on their balance sheets in 2008-09. Since then many of the banks have started to increase their dividend payments again until the recent COVID-19 forces the Fed to cap the dividend payments of banks.
With the global economy in a tailspin and recession upon us, it is hard to foresee banks being stable dividend payers in the years ahead, with the risk of substantial asset impairment possibly result in a huge financial drain on their balance sheet.
Dividend Aristocrats in this category include:
- Aflac (AFL)
- Cincinnati Financial (CINF)
- Franklin Resources (BEN)
- S&P Global (SPGI)
- T. Rowe Price Group (TROW)
- Chubb (CB)
- People’s United Financial (PBCT)
Energy Companies
Large-cap energy companies like BP, Shell, Chevron, and Exxon Mobil have a history of paying strong dividends. However, the situation now is drastically different. At one stage in 2020, a year fraud by the COVID-19 pandemic, WTI prices went into negative territory which was unheard of in the history of volatile oil prices.
With low demand (global recession) and a supply glut in the industry, oil prices remain under tremendous pressure which has consequently resulted in depressed earnings for many major oil companies. Blue Chip oil companies have started cutting their dividends in drove, with notable ones being BP and Shell, the latter after decades of dividend-paying track record.
There are currently just 2 companies in the O&G industry that still calls themselves Dividend Aristocrat although the figure could very well dwindle to just 1 by the end of this year.
Dividend Aristocrats in this category include:
- Chevron (CVX)
- Exxon Mobil (XOM) – high risk of a dividend cut
Utilities
Utility companies tend to be very stable and predictable businesses that generate strong cash flow. Because consumers will always need water, electricity, natural gas, propane, and home heating oil to provide for their basic needs, utility companies tend to weather economic downturns particularly well.
Utilities also operate as franchises that give them the exclusive right to supply electricity, water, or natural gas to a particular area, which means they don’t have to worry about a competitive company coming in and eating their lunch. Utility companies have huge infrastructure requirements and can use the same infrastructure for decades. It simply wouldn’t be cost-effective for a new company to come in and try to rebuild existing infrastructure from scratch.
From an investment perspective, utilities tend to have relatively stable share prices and have limited opportunities for long-term capital gains. Utilities also tend not to raise their dividend much faster than inflation and generally payout 60% to 80% of their earnings in the form of a dividend. Although utilities offer limited long-term capital gains and dividend growth, they tend to offer very high dividend yields to attract investor dollars. Utility companies currently pay dividend yields between 3% and 6%.
Dividend Aristocrats in this category include:
- Atmos Energy (ATO)
- Consolidated Edison (ED)
REITs
Real estate investment trusts (REITs) are a special type of corporate entity used to own and operate income-producing commercial real estate, such as restaurants, hotels, malls, warehouses, and hospitals, and other medical facilities. REITs can either be publicly traded on a stock exchange or privately held.
Publicly traded REITs allow individual investors to invest in commercial real-estate projects while maintaining the liquidity of their investment, meaning they can sell their shares on public markets at any time.
REITs are required by law to payout 90% of their earnings as dividends to their shareholders, which means they tend to offer above-average dividend yields.
Dividend Aristocrats in this category include:
- Essex Property Trust (ESS)
- Federal Realty Investment Trust (FRT)
- Realty Income (O)
Chapter 3: What makes a good Dividend Stock?
The 3 Key Tenets of Dividend Investing
- Dividend Investing: The Yield
When it comes to dividend investing returns, there are two key components: 1) Returns from dividends and 2) Returns from price appreciation. The importance of dividend return often gets ignored because price appreciation garners much more attention during bull market periods. However, over a longer-term horizon, dividends account for a stable and significant part of the equity premium. Going back to 1970, 78% of the total return of the S&P500 Index can be attributed to reinvested dividends and the power of compounding, as we have earlier highlighted using data from Hartford funds.
As we are coming towards the tail-end of the business-cycle with a global recession happening right now, returns from capital appreciation will likely play second fiddle to that of dividend returns. Dividend investing will likely see increasing importance.
- Dividend Investing: The Safety
Consistency in dividend payments or what we termed as dividend safety is essential to the success of a dividend investing strategy. Chasing the highest yielding stock is often a key investment fallacy undertaken by newbie dividend investors.
Sustainability of dividend payments should be given higher priority because companies that pay out a significant share of their earnings in dividends might 1) not be able to sustain such a dividend trend which implies that future dividend payment might fall or 2) they are not reinvesting back into their business to further grow the top-line.
When it comes to dividend safety, strong balance sheets, and robust underlying economics of the business, coupled with low or moderate pay-out ratio are key indicators crucial in dividend investing.
- Dividend Investing: The Growth
While dividends are an important component of a counter’s total returns, it has been proven that companies that consistently grow their dividend payments have outperformed dividend payers lacking dividend growth by as much as 34%, according to studies done by research firm Ned Davis. The combination of a high dividend yields today and even higher dividend payments tomorrow can serve as a potent tonic for one’s dividend investing portfolio.
Putting the pieces together to complete the puzzle
A quality dividend investing strategy will consider each factor that influences the performance of dividend-paying companies.
I develop the following tried-and-tested rules for dividend investing. I have broken down the most important practices that all dividend investors should know and follow and narrowed down to a list of 7 rules designed to help you navigate and overcome the pitfalls of dividend investing.
Dividend Investing Golden Rule #1 – Growth Rule: Invest in stocks with track records of dividend growth
Quality beats Quantity. You want to be invested in stocks that not only spot a higher-than-average yield but one that has shown consistency in increasing their annual dividend payments. Before investing in any dividend-paying stock, be sure to check its dividend history first. Make sure the company has not cut its dividend payment recently. Another shortfall is stagnant dividend payments, one where the company has not increased its dividend payments for a long-time.
In general, dividend investors should look for dividend stocks with a dividend CAGR of 3% over the past 5 years.
Dividend Investing Golden Rule #2 – Bargain Rule: Invest in stocks with a higher-than-average yield to maximize cash flow from your investments
Everyone loves a good bargain. If a stock passes Rule #1, which is an up-trending dividend payment profile, then one should look at choosing a counter with higher-than-average dividend yield payment. The current yield of the STI Index is approx. 3.7% while that of the S&P500 is approx. 2.0%.
As a simple rule of thumb, we will classify a stock with a yield of over 4% as one that is high-yielding in nature. High yielding dividend stocks have typically outperformed lower-yielding dividend stocks and non-dividend payers as well as dividend cutters by significant amounts, as illustrated in the table below, based on data from Ned Davis Research and Hartford Funds, illustrating the performances from 1972-2019.
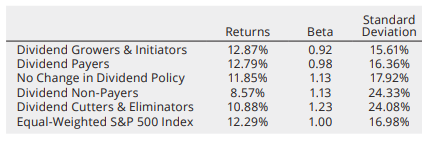
The best performers, however, have been dividend growers, that is why they sit atop as our Rule #1.
A word of caution. Do not simply go for the highest yielding stocks (more on that in Rule #3). These stocks might be paying out too much in dividends and retaining too little to grow their business.
Dividend Investing Golden Rule #3 – Dividend-Trap Rule: Invest in stocks that do not have high pay-out ratios
Simply chasing after high yield counters that cannot sustain their dividend payments is a common dividend investing mistake that rookie investors make. Such stocks are Dividend traps, meaning that their high yield is nothing more than temporary bait to lure investors seeking high yield. However, that high-yield is often an illusion, one that is not sustainable.
One simple way of checking of a dividend payment is sustainable is by looking at the counter’s payout ratio. This refers to the percentage of its net income the company pays out in dividends. If a company earned $5/share and paid out $3/share in dividends, it would have a Payout Ratio of 60%.
A Payout Ratio below 60% is typically within an acceptable range for a mature business that does not have to reinvest a large chunk of its earnings back for growth.
A Payout Ratio of 75% or higher could be difficult to sustain if a company experiences a prolonged drop in earnings
There are however some exceptions to this rule. For example, REITs typically have Payout ratios above 90%. Another example is when the economy is in a deep recession, a company’s earnings might be temporarily hit, which pushes their Payout ratio unusually high. As long as the company has a strong cash buffer with no structural impact on its core business profile, then it should not have too much problem maintaining its current dividend payment.
Dividend Investing Golden Rule #4 – Sustainability Rule: Invest in stocks that are showing an uptrend in revenue growth
It is not sustainable for a counter to have a growing dividend payment profile but yet demonstrate sustained weakness in its core business revenue. A company’s operational growth is what drives its ability to pay higher dividends. Revenue growth is often the very first requisite towards generating sustained higher earnings and consequently the ability to pay more dividends.
While a company’s cost-cutting efforts can lead to an improvement in its bottom-line, there is limited scope for cost-cutting initiatives to continuously drive earnings improvement without a corresponding rise in revenue.
One point to note. Competition among companies has intensified due to globalization and the rapid pace of innovation. Even a blue-chip today with a fantastic track record of consistent revenue, earnings, and dividend growth might cease to be relevant in a changing structural environment.
It’s no longer enough to just buy a blue-chip dividend payer and not look at it for the next 30 years and assume that everything will work out fine. Having a laissez-faire approach might work in the past but could be a recipe for disaster in today’s rapidly changing landscape.
Dividend Investing Golden Rule #5 – Cash is King Rule: Invest in dividend stocks that are generating consistent cash flow
The best dividend stocks are often those that demonstrate the ability to generate consistent cash flow. It is the actual cash that is used for dividend payments, not just the fact that a company is generating higher revenue or earnings. Higher revenue or earnings generation that is not accompanied by a corresponding increase in cash flow over time is a potential red flag and a clear signal that dividend growth is not sustainable.
Also, look out for companies that might have huge capital expenditure requirements ahead which might stifle their ability to pay higher dividends.
Dividend Investing Golden Rule #6 – Sleep-tight Rule: Invest in dividend stocks that are not overly volatile
Stocks with lower volatility have a history of outperforming higher volatility stocks in all business cycles. Dividend stocks by nature tend to exhibit lower volatility.
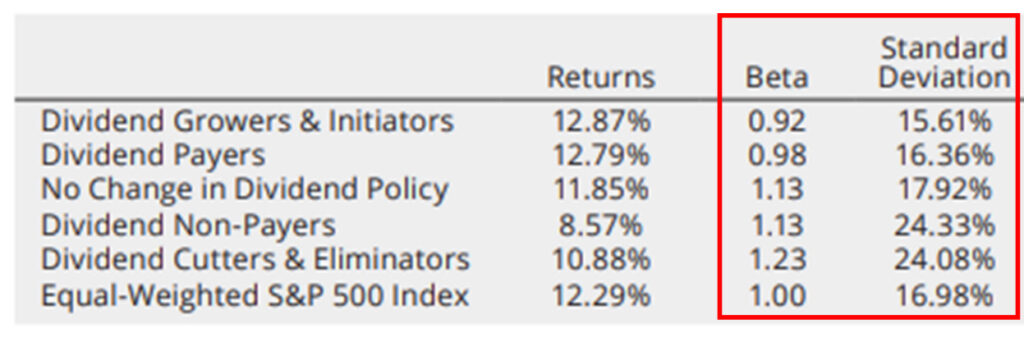
Their businesses are more mature and stable vs. growth stocks (non-dividend payers) and hence lower the probability of “negative/positive earnings surprises” that tends to escalate their stock price volatility. This runs counter to the prevailing belief in investing that higher risks are generally rewarded with higher returns.
However, this is not a one-rule fit all scenario. There are still many high dividend stocks with high volatility aka high risk. Since risk is not rewarded, one should be selective and focus on low-risk stocks that also exhibit high and stable dividends.
Dividend Investing Golden Rule #7 – Time-to-sell Rule: Develop a sell strategy and stick to it. Cutting of dividend could be seen as a major red flag
Most investors focus on buying and neglect the selling. This rule is quite possibly the most important one of all. Dividend investors always need to keep in mind that engaging a “Buy and Hold” strategy does not mean “Buy and Hold and Forget, regardless of how far the stock has fallen”, many times reasonably so.
Dividend investors should also develop a sell strategy to protect profits and minimize losses. It is time to sell when a stock is overpriced, using certain metrics like Price/Earnings ratio or when a stock has fallen significantly below your entry level (-15% could be the initial threshold). In the latter’s case, we suggest taking a close look at the company’s statistics to assure yourself that its fundamentals have not witnessed a structural change for the worse.
Sometimes, a drop of 15 or 20% could just be the effect of market gyration and not company-specific. Usually, however, such a drop, particularly in a short period, could indicate company-specific problems that warrant further investigation.
With these 7 Golden Rules in mind, let’s now proceed to look at 8 key financial ratios to identify the “best of the best” dividend stocks, those that not only pay a decent yield but those which demonstrate the ability to grow their dividend payment year after year.
Dividend Investing Key Financial Ratios
Dividend Investing Key Financial Ratio #1: Dividend Payout
The dividend payout ratio is one of the more important ratios that a dividend investor should be aware of. The dividend payout ratio measures how much of a company’s earnings are paid out as a dividend.
The calculation of a company’s dividend payout ratio is quite simple:
Payout ratio = Dividends paid / Earnings Generated (over the same period)
For example, McDonald’s latest quarterly dividend per share amounts to USD$1.25. The company is forecasted to pay a full-year dividend of USD$5/share in 2020. With earnings of USD$8.48 forecasted for 2020, the company’s payout ratio is USD$5/USD8.48 = 59%
Investors like to analyze the dividend payout ratio because it can inform how safe a company’s dividend is and how much room it has for future growth.
A dividend payout ratio below 60% is typically very sustainable. However, there are occasions where one can also invest in companies with higher payout ratios (over 70%), particularly if their businesses tend to be very stable such as utility companies.
A dividend payout ratio significantly above 70% might be a risk in terms of dividend sustainability. The company is paying out the bulk of its earnings as dividends, leaving little for reinvesting into growth. If the company’s business is negatively impacted by changing trends, there might not be enough profits to sustain dividend payments ahead.
A good dividend company that fits the low payout ratio profile is McCormick & Company, a dividend aristocrat (a company that has increased its dividend payments for 25 consecutive years or more. More on that in the next segment).
The company has boosted its dividends by 34 straight years. With a dividend payout ratio of only 40%, the company has plenty of “excess bandwidth” to continue its dividend growth trajectory.
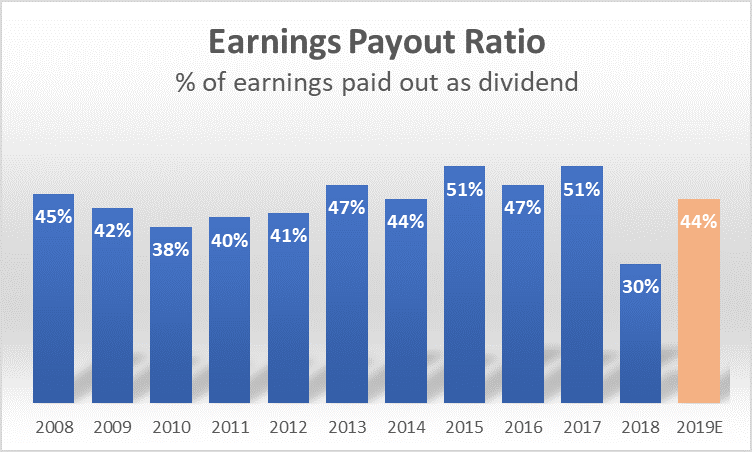
The company’s relatively flat payout ratio means that its dividend growth has been sustainably fuelled by growth in its earnings.
Dividend Investing Key Financial Ratio #2: Dividend Growth
Dividend growth ranks highly as one of the top criteria for any dividend investors. Currently, there are 65 Dividend Aristocrats in the S&P 500. All these companies have improved the amount of their total annual dividend payments every year for at least 25 years (and in many cases, they have done it for much longer).
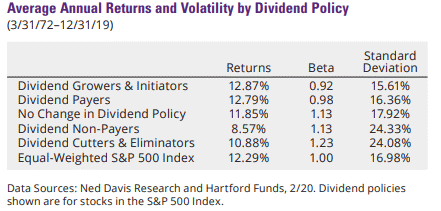
According to data from Ned Davis Research and Hartford funds, based on stocks within the S&P 500 index, stocks that exhibit dividend growth profiles generated the best performing returns from 1972-2019.
Not only that, but these returns were also achieved with lower beta and standard deviation.
Corporations that consistently grow their dividends have historically exhibited strong fundamentals, solid business plans, and a deep commitment to their shareholders. Consistent dividend growth is only achievable with a corresponding consistency in terms of earnings and free cash flow growth, resulting in a build-up of cash on a corporate balance sheet.
This excess cash should allow businesses with existing dividends to maintain, if not grow, their dividends.
With interest rates expected to remain low in the foreseeable future, this means dividend-paying stocks should continue to offer attractive yields relative to many fixed-income asset classes.
Ideally, we will like to see a dividend growth rate > 5%/annum
Dividend Investing Key Financial Ratio #3: Free Cash Flow
Free cash flow is the lifeline of any business.
Free cash flow is simply operating cash inflow minus operating cash outflow minus the cash outflow for capital acquisitions such as equipment or vehicle. This financial metric is calculated using the company’s statement of cash flows.
Free cash flow = Cash flow from operations – Capital expenditure
If a company does not generate free cash flow, it will not have excess funds to return to shareholders by either dividend payments or share repurchases. Nor does it have the flexibility to acquire new businesses using its cash-on-hand or pare down its debt burden.
Companies that fail to generate free cash flow are typically those that are exhibiting high-growth, which means they need to reinvest cash flow into their working capital or one which requires a consistently high amount of capital expenditure to maintain its competitive advantage (or lack of).
Dividend investors typically look for companies that consistently generate free cash flow in virtually every environment.
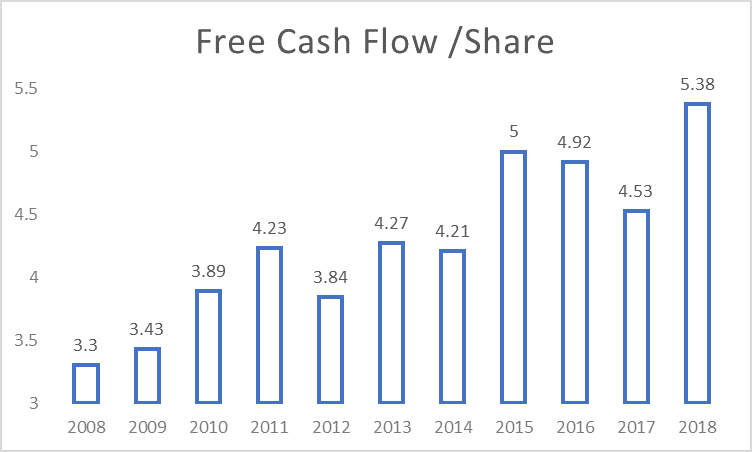
The above diagram illustrates the free cash flow/share profile of McDonald’s. Its operations require little capital and the company is a recession-proof company that typically enjoys high “recurring” revenue, resulting in extremely consistent free cash flow generation.
On the other end of the spectrum, you have a company like Arcelor Mittal, a steel company that has been an unpredictable free cash flow generator. Being a commodity company, Arcelor is a price taker for its steel products. When times are good and the economy is expanding, demand for its products is strong and the company might benefit from stronger product pricing.
In a recession, the converse might be true.
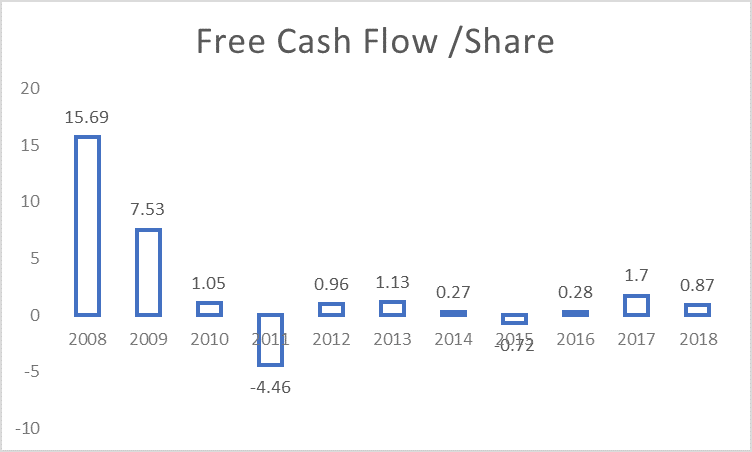
Looking at free cash flow generation alone, the choice is clear. A dividend investor will select McDonald over Arcelor Mittal as the former is the clear winner in terms of dividend payment reliability.
Using Free Cash Flow against Enterprise value has also proven to be one of the best if not the best valuation metric as a stock price predictor.
Dividend Investing Key Financial Ratio #4: Return on Invested Capital
Imagine if you have got $100 to invest. Venture A can turn that $100 into $105 while Venture B can turn that $100 capital into $110. One would pick Venture B to invest the $100 as it can grow your money faster.
This is a simple analogy to explain what return on invested capital or ROIC (in short), is all about. Businesses will take funds (either equity or borrowings) and invest to generate a return for shareholders.
ROIC = Net profit / (Total debt + Total Shareholder Equity)
A simpler financial ratio, which is one of Warren Buffett’s favorite is to find companies with high Return on Equity or ROE for short. ROE is calculated as Net profit / Total Shareholder Equity
Using ROIC takes into account a company’s capital structure so we can better compare them. A company with zero debt will have the same ROIC and ROE ratios.
Why is ROIC a better financial ratio vs. ROE?
Let’s use an example to illustrate the concept of ROIC.
Assume two kids, Peter and David, both started a business of selling chewing gum to the local community. Peter generated $20 in profits vs. David which generated $18 in profits. On the surface, it might seem that Peter did a better job of running his chewing gum business.
Our entrepreneurial kids decide it is now time to invite the public to partake in their businesses. Before jumping to the conclusion that Peter’s business is the superior one to invest in, let’s take a step back and look at the capital employed by both kids.
To achieve a profit of $20, Peter used his savings of $100 (equity) and borrowed an additional amount of $50 (debt) from his parents to fund his chewing gum business.
David, on the other hand, used only his savings of $100 (equity) to start up his business without any borrowings.
Using the ROE metric, one would have concluded that Peter, with an ROE of 20 / 100 = 20% is superior to David with an ROE of 18 / 100 = 18%.
However, note that Peter used extra funding (debt) of $50 which he borrows from his parents to generate that $20 in profits. Without that extra capital, his profit might have been way lower than $20.
Using the ROIC metric, the ROIC for Peter would have been 13.3% (20 / 150) while that of David would have been 18% (18 / 100).
David is more superior in deploying his resources/available capital to generate earnings in this example. Put it simply, Company A can generate 2x the amount profits of Company B, but if Company A requires 10x the amount of capital to achieve that, then it’s far inferior to Company B in terms of capital deployment.
When we analyze a company’s return on invested capital, we look at the level (ideally more than 15%) and the consistency of its returns (does it generate ROIC of 15% one year which drops to 5% the next? Or is this ratio consistently stable?)
Stable, mid-high teens return on invested capital over many years is often a positive signal that one is looking at a highly profitable, efficient company that demonstrates an economic moat.
I have written about stocks with high ROIC as the key investment metric that leads to outperformance.
Dividend Investing Key Financial Ratio #5: Sales growth
Sales growth is a basic financial metric that subtracts one period’s revenue from the prior year’s revenue and expresses the differences as a percentage of the earlier year.
Sales growth = (Year 2 Sales – Year 1 sales) / Year 1 sales
While generating operating profits and free cash flow scores high in terms of our financial check-list, the ability to demonstrate consistent sales growth shows that a company has a viable growing business with a strong structural uptrend vs. one that is cyclical where the risk of buying near/at the peak is a sure formula to lose money – quickly.
For example, would one be more comfortable buying into a cyclical business-like Arcelor Mittal or a stable growing consumer staple company like Clorox?
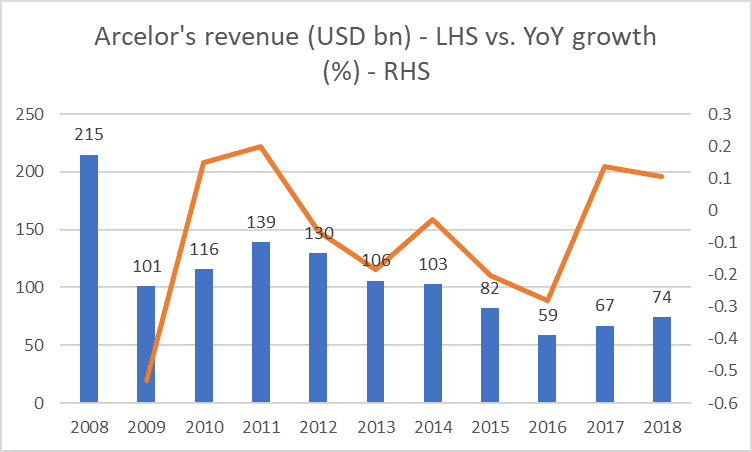
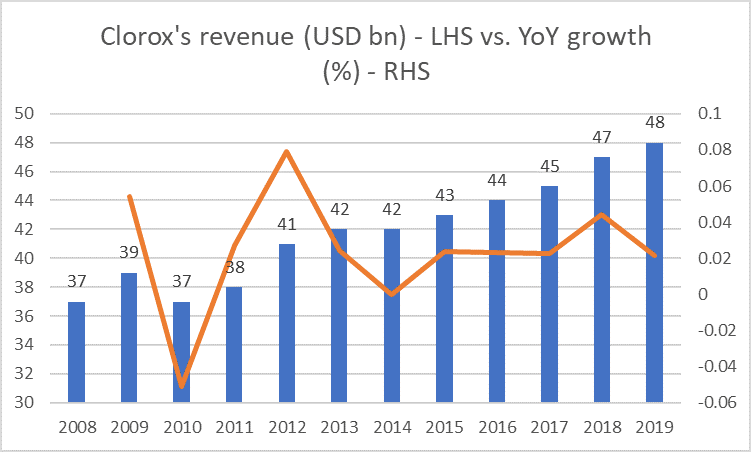
All else equal, we prefer to hold businesses that sell products and services with more stable demand.
Dividend Investing Key Financial Ratio #6: Net Debt to Equity
Financial leverage can often be a double-edged sword. During good times, the usage of cheap debt is an excellent way to grow a business. However, when times are bad, the banks will be the first one that comes knocking on your door.
Hence it is for that very reason that we will like a company to demonstrate a low net debt to equity ratio, preferably less than 60%.
This ratio is simply calculated as:
Net debt to equity = (Total debt – Total Cash) / (Total shareholder’s equity)
A company that has a high net debt to equity might find that they have to prioritize the payment of interest and repayment of debt vs. making dividend payments when the going gets tough. Companies will always pay their debt obligations before paying a dividend.
Alternatively, a company with a strong balance sheet with plenty of cash could be in net cash to an equity position.
Notwithstanding the issue of efficient capital structure, such a company will be in a very comfortable position to continue making dividend payments, even if its core operations might be facing short-term hiccups that result in a decline in both revenue and earnings in the interim.
Dividend Investing Key Financial Ratio #7: Total Shareholder Return
While looking at a company’s dividend yield is one way of getting started on building your portfolio of dividend counters, one should keep THE big picture in sight.
THE big picture is to look at Total Shareholder’s Return.
Total Shareholder’s Return = Dividend return + Capital appreciation return
Granted that capital appreciation of a counter is often not within one’s control and could exhibit significant variation in a volatile market, the idea is not to solely focus on the yield potential of a stock.
What good is a counter if it provides a high yield of 6-8%/annum but whose share price consistently declines by 10-20%/annum, resulting in a negative total shareholder’s return?
When a company has persistently destroyed shareholder value, investors need to ask themselves why this trend would reverse any time soon. Is there a structural decline in the company’s business model or the industry as a whole that will not result in any significant share price appreciation any time soon?
Dividend Investing Key Financial Ratio #8: Share Buy Backs
While not viewed as a direct manner of returning wealth to shareholders, share buybacks are now viewed as a flexible practice to put money back into shareholders’ pockets. There has been a huge debate of late about corporates engaging in debt to fund share buybacks (look at airline companies). We prefer these buybacks to be funded with free cash flow regardless of how cheap debt might be.
By definition, stock buybacks allow companies to reinvest in themselves by reducing the number of outstanding shares on the market. A company can pursue a policy of returning wealth to shareholders by 1) paying dividends, 2) share buybacks or 3) a combination of both.
A company that reduces its outstanding shares through share buybacks will automatically increase its dividend per share (same dividend amount divided by a lower denominator).
Let’s take Clorox as an example
The company has been consistently reducing its outstanding shares from 139.6m in 2008 to 125.9m in 2019.
During this time, dividend payments increased from USD$228m to USD$534m or a CAGR growth of 8%
Dividend per share (DPS) increased from USD$1.60 to USD$4.24 or a CAGR of 9.3%. The differential in the compounded annual growth rate is due to the effect of share buy-back. If the number of outstanding shares remained as 139.6m in 2019, 2019 DPS would have been USD$3.83 vs. $4.24.
The above 8 key financial ratios to screen and identify good dividend stocks is a useful way to get started on your dividend investing strategy.
Financial Ratios Checklist
- Dividend Payout Ratio < 60%
- Dividend growth > 5%
- Positive Free Cash Flow
- Return on Invested Capital (ROIC) > 15%
- Sales Growth > 5%
- Net debt to equity < 60%
- Total Shareholder Return > 10% annually
- Share buyback using free cash flow
The next step would be to combine those financial ratios with an evaluation of the company’s economic moat.
What is an economic moat?
This term was invented by the legendary Mr. Warren Buffett who believes that if a company possesses an economic moat (sustainable competitive advantage), it will be in a good position to not just thrive but excel over its competitors.
Having an economic moat is what separates a good business from a bad one, a reliable dividend payer from a risky one, and an attractive total return from a mediocre one.
Virtually every business faces competition unless they are in an enviable position of being a monopoly. However, only some businesses can successfully defend their operations from competitive threats due to the presence of one or more economic moats or competitive advantage.
Below are various forms of economic moats which I believe will be useful in complementing the 8 financial ratios highlighted above in our dividend investing strategy.
Economic moat #1: Strong Pricing Power/High switching cost
If a company has got strong pricing power, it can raise its product/service prices every year and yet does not have to worry about losing its business to competitors. According to Warren Buffett, this is probably the single most important decision when evaluating a business. He made this comment about his investments in Moody’s.
“Dun and Bradstreet had a very good business, and Moody’s had an even better business. And basically, the single-most-important decision in evaluating a business is pricing power. If you’ve got the power to raise prices without losing business to a competitor, you’ve got a very good business. And if you have to have a prayer session before raising the price by a tenth of a cent, then you’ve got a terrible business. I’ve been in both, and I know the difference”.
Warren Buffett
For a company to grow its revenue, its either through volume or price or both. It might be possible for a company to ramp up volume sales by undercutting its competitors on price. However, to be able to increase its product/service prices and not worry about losing its customers to competitors indicates the presence of this strong economic moat. Companies with pricing power can withstand economic slowdowns better than most and are in a strong position to defend their market share.
A company that ticks the boxes on all the above 8 key financial ratios highlighted with boast strong pricing power is Microsoft.
Another dividend-paying company that has high switching costs which result in stronger pricing power is Apple. The company has successfully created an ecosystem that has become its strongest economic moat. For an iPhone who has been so accustomed to using the suite of Apple-related products such as iTunes, iCloud, iPad, MacBook, switching to an android phone will be a major hassle.
This thus allows Apple to increase prices (look at how the prices of iPhones have trended up over the years with each upgrade) and yet not be concern about losing customers to competitors.
Economic moat #2: Strong cost advantage
Companies with huge economies of scale can deliver their goods or services at a low cost and thus have a distinct competitive advantage.
The best example here will be Walmart. It is a low-cost producer and its low costs allow it to price its products the most attractively. It has huge operating leverage which it uses effectively to keep costs low for consumers. Given its size, the company is in a strong bargaining position with its suppliers to get the best pricing terms for itself and its customers.
Walmart recognizes that it is operating in a commodity industry. Everybody can get their hands on toilet papers (maybe not in today’s context) to re-sell. That is why it is relentless in reducing its costs. The lower you go, the deeper the moat.
Besides bargaining power with suppliers, a key reason why Walmart can enjoy this moat s due to the management of Walmart stores as a network. The company limits cost through a management and distribution structure that serves multiple stores in a geographic area. The network of stores allows Walmart to limit its stock in any given store and share managerial expenses across the network. The moat is deep—efficiencies flow from a 5,000-store network.
Walmart is also a company that ticks all the 8 financial ratios/metrics above and yet possess this moat.
Using another example from Warren Buffett himself, he describes his insurance arm GEICO as a company that possesses this moat. GEICO did not stumble upon low-cost production as its moat. It was essential for the market.
“Most people will assume the service is fairly identical among [car insurance] companies, or close enough, so they’re going to do it on cost, so I gotta be the low-cost producer. That’s my moat. To the extent my costs get further lower than the other guy, I’ve thrown a couple of sharks into the moat”.
Warren Buffett
Economic Moat #3: Intangible assets/strong branding
These are companies that possess a strong brand that is immediately recognizable or a huge pipeline of patents that protects the pricing power of its products. These are assets that are not easily quantifiable.
Intangible assets can include government licenses, intellectual property, trademarks, copyrights, patents, government licenses, etc.
Many pharmaceutical companies depend on their intangible assets ie patents to protect their pricing power for key products or prevent competitors from duplicating their products. When patents expire, generic competition can quickly push the prices of drugs down more than 80%.
Another well-known dividend payer example will be Starbucks. This company ticks all the 8 key financial ratios and has been a dividend payer since 2010. While there might be some concerns over COVID-19 driven store closures affecting the company’s earnings in 2020, the branded coffee chain-store will likely emerge out of this crisis unscathed and potentially gain market share from less well-known branded coffee stores.
According to a recent BAV Group research, Starbucks score highly in terms of brand esteem and differentiation, alongside Apple and Amazon.
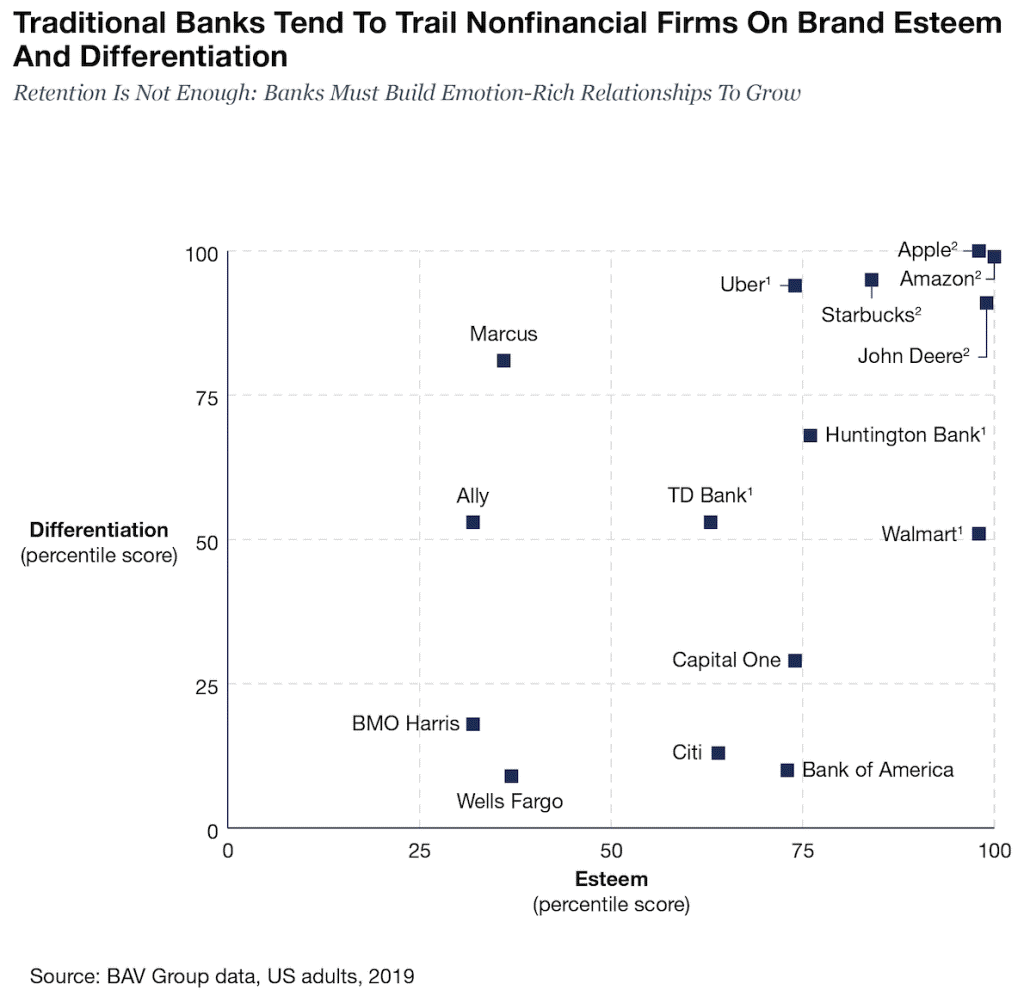
According to Morningstar, Starbucks’ wide economic moat comes from its brand intangible asset that commands premium pricing combined with meaningful scale advantages. With a widely recognized brand, Starbucks is among the few retail concepts to be successfully replicated across the globe.
(Quick hack: For those looking to get access to Morningstar latest analysis report on companies, type the following “analysisreport.morningstar.com” followed by the stock name in google. Find Morningstar latest Starbucks report)
Economic Moat #4: Network Effect
The network effect is one of the most powerful competitive advantages and it is also one of the easiest to spot.
A network effect is present when the value of a particular good or service increases for both new and existing users as more people use that good or service.
Facebook is the most well-known example of possessing network moat, however, the counter does not yet pay any dividends. When a network has strong social engagement like Facebook, adding more users increases the value of the network for everyone.
Amazon is another well-known example but it too does not pay a dividend. Where a network matches buyers and sellers like Amazon, increasing the network size increases choice and by extension, value.
Another company that has a huge network effect and recently started paying a dividend in 2019 is eBay.
The term “critical mass” is often used in connection with the network effect. If the user base for a product or service reaches a critical mass, the network is likely to expand under its power. The main barrier to the network effect’s taking place is getting enough users so that the effect occurs. At critical mass, the value obtained will be greater than or equal to the price paid for the goods or services.
eBay manages its end consumers and merchants through their websites. Consumers aren’t interested in buying from these websites unless there are a variety of products available, which means that enough merchants must be present. Once the users arrive, more merchants will start coming on board, and eBay will start enjoying the maximum benefit of the network effect.
While investing involves plenty of unknowns and a large degree of uncertainty at times, a dividend investor can reduce committing avoidable mistakes in his/her dividend investment journey by focusing on these 8 key financial ratios/metrics.
When combined with the presence of wide-moat businesses, this dividend investing strategy will excel even further.
Chapter 4: Where to Find Great Dividend Stocks and how to value them
You now know the qualitative and quantitative metrics that investors should use to measure the quality of a dividend stock but how do you find attractive dividend stocks that meet the criteria in Chapter 3? Once you found them, how should you proceed to evaluate their attractiveness from a valuation standpoint?
There are now several websites, tools, and lists that cater to dividend investors, which makes it very easy to identify great dividend stocks. I will provide a brief run-through on these resources before attempting to create our very own NAOF portfolio of dividend blue-chip stocks, as well as discuss a simple valuation method solely catered for dividend stocks.
The Dividend Kings
These are the “best of the best” stocks, companies that have raised their dividend every year for more than 50 consecutive years. Companies that have a track record of raising their dividend each year for more than five decades have competitive advantages that stand the test of time. As of the publishing of this guide, there are currently 30 companies listed on the Dividend Kings list.
In 2019, the Dividend Kings as a basket underperformed the S&P 500 ETF (SPY) by a fairly wide margin. Stable dividend growers like the Dividend Kings tend to underperform in bull markets and outperform on a relative basis during bear markets.
The Dividend Kings are not officially regulated and monitored by any one company. There’s no Dividend King ETF. This means that tracking the historical performance of the Dividend Kings can be difficult. More specifically, performance tracking of the Dividend Kings often introduces significant survivorship bias.
Survivorship bias occurs when one looks at only the companies that ‘survived’ the period in question. In the case of Dividend Kings, this means that the performance study does not include ex-Kings that reduced their dividends, was acquired, etc.
But with that said, there is something to be gained from investigating the historical performance of the Dividend Kings. Specifically, the performance of the Dividend Kings shows that ‘boring’ established blue-chip stocks that increase their dividend year-after-year can significantly outperform over long periods.
A list of the 2020 Dividend Kings can be found here.
The S&P Dividend Aristocrats
The S&P Dividend Aristocrats list is a list of S&P 500 companies that have raised their dividend every year for at least the last 25 years. To be included in the list, companies must have a minimum market cap of $3 billion and an average daily trading volume of $5 million.
As of 2020, there are currently 65 companies listed on the S&P Dividend Aristocrats list. You can view a list of the companies here.
Rather than buying stocks which are “cheap” or present “value” characteristic, buying a basket of dividend aristocrat stocks have shown to significantly outperform their value counterpart over the past 10 years, based on data from S&P Global.
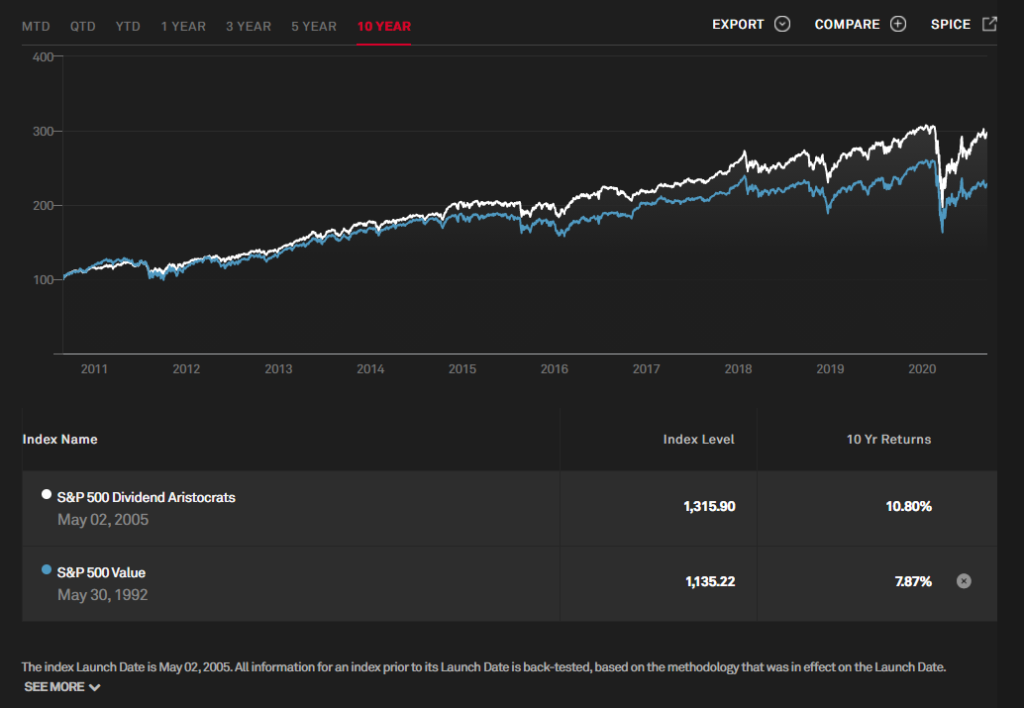
While a “value” criteria might include meeting certain financial ratio criteria such as low PER, low PBR, etc, selecting these stocks based on their “cheapness” might turn out to be an erroneous one if their operating profile remains weak.
Dividend aristocrat stocks, on the other hand, are those that have the earnings and cash flow to support increasing its dividend for 25 consecutive years. For them to do that, there will likely be the presence of an economic moat or other competitive advantages that allows the company to outperform its competitors.
The Nasdaq Dividend Achievers Select Index
The NASDAQ Dividend Achievers Select Index is a list of 212 companies (as of Sep 2020) that have raised their dividend each year for at least the last 10 years. To be included in the Dividend Achievers Index, a company must be a member of the NASDAQ US Benchmark Index and meet certain minimum capitalization and liquidity requirements. You can view a list of companies that are currently included in the Dividend Achievers Index here.
The companies listed in the Dividend Achievers Index have similar qualities to the companies listed in the S&P 500 Dividend Aristocrats Index. They have a track record of steadily raising their dividends, they have earnings and cash flow to support their dividend payments, and they have lower volatility than the broader market. The major difference is that the companies in the Dividend Achievers Index do not have as long of a track record of raising their dividends as those in the Dividend Aristocrats Index do.
Dividend Champion List
This is a list of stocks created by David Fish and updated by Justin Law every month which reflects companies that have increased their dividend every year for the past 25 years (without criteria for liquidity and market cap). These stocks are the Dividend Champions.
Besides the Champions, the list also includes stock called the Contenders, companies who have increased their dividend for the past 10 years and Challengers are those who increased for the past 5 years.
This is a very useful dividend list that not only tracks dividend information of these stocks but also the key financial ratios.
Those who are interested can download the list over here.
SureDividend.com
SureDividend.com is a website that provides educational information about dividend investing and analysis of individual dividend stocks. Publisher Ben Reynolds does a great job of going behind the numbers and analyzing the business model and future growth prospects for any given stock. He also writes great educational content that teaches readers how to think about dividend investing and how to analyze dividend stocks.
Simply Safe Dividends
Simply Safe Dividends is founded in 2015 by Brian Bollinger, an equity research analyst, a former partner at a leading investment firm, and a licensed CPA. His main inspiration for establishing SSD was the increasing popularity of dividend portfolios after the housing bubble with the introduction of the zero-interest-rate policy.
Bollinger describes the SSD platform as a “one-stop-shop for responsible income investing.” The investment philosophy of the company is simple and clear. Bollinger has likened purchasing stocks to purchasing a home, with the goal being capital appreciation and income generation.
The website provides a ton of research information about dividend stocks. Head over here to check out some of the top Dividend ideas short-listed by Brian.
Creating our own NAOF Dividend Blue Chip List
I look to screen for NAOF’s dividend blue-chip list. This list comprises some of the strongest dividend growers. In addition to having a robust dividend growth profile, this list of S&P 500 stocks also has to demonstrate a certain level of sales and earnings growth.
The key criteria of the scan are as below:
- Dividend Yield: >1.5 and < 5.75
- Dividend 1-year Change (%): 5
- Dividend 3-year Change (%): 5
- Dividend 5-year Change (%): 5
- EPS 5-year Average (%): 8
- Payout ratio: > 10 and < 70
- Sales 5-year Average (%): 5
- S&P 500 stocks
- Consecutive dividend growth years: 10+
Based on the criteria above, we have a total of just 10 stocks that fit this profile as illustrated in the table below. Are these stocks the “best of the best” dividend growers?

Many of these dividend growers are expected to continue growing their dividends strongly in 2020, with an average dividend growth rate of 20%.
Most of these counters are also expected to show strong EPS growth in the next forward financial year as well as based on the street’s 5-year EPS growth estimate.
Among the 10 stocks, L3harris Technologies has the largest upside potential based on the street’s estimate of its potential fair value.
Notice that the list of stocks is not exactly “high” dividend-yielding stocks but are strong dividend growers. While it will be nice to have stocks that combine both high yielding and strong dividend growth characteristics, these stocks are far and few.
The focus on strong dividend growers over high yielding stocks have demonstrated to pay better “dividends” in terms of total shareholders’ return over the long run.
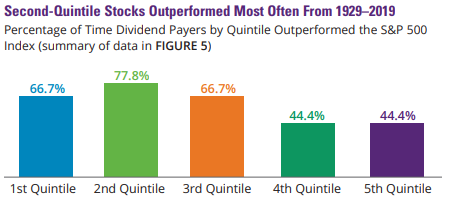
Research by Wellington Management and Hartford Funds have also shown that dividend payers in the 2nd Quintile, tend to demonstrate the greatest outperformance vs. the S&P 500. Hence, it is not the highest yielding stock that will outperform the most.
An exception will be investing in REITs, an asset class that is mandated to pay out the bulk of its earnings (90%) to shareholders in the form of dividends. These stocks might typically pay 4-6%/annum in terms of dividend yield. I have previously written an Ultimate Guide to REITs which is a useful study for those wishing to learn more about this particular asset class.
An important point to note about REITs is that this asset class was the best performing asset class over the past decade.
After short-listing a list of stocks, the next step would be to estimate a fair value for entry into the stock.
Using the Dividend Yield Theory to find a fair value estimate
Dividend Yield Theory is a lesser-known valuation method that is applied to only stocks that pay a dividend (hence the name). This theory has been popularised by Investment Quality Trends or IQT for short, an investment newsletter publisher.
Since 1966, IQT has provided investors the research, analysis, and tools to identify high quality, blue-chip stocks and to know when they offer good value which is the information one will need to make informed, buy, sell and hold decisions about stocks for their portfolio.
IQT co-founder, Geraldine Weiss, was known for her unconventional value approach investment style by focusing on a company’s dividends rather than earnings. She popularised the theory of using dividend yield as a valuation metric by indicating that there is a strong correlation between a company’s ability to pay dividends over time vs. its stock price performance.
She was the co-author of the book “Dividends Don’t Lie: Finding Value in Blue Chip Stocks”. This book teaches a value-based approach to invest by using the Dividend-Yield Theory as a means to produce consistent returns in the stock market. Rather than focus on the nitty-gritty details of a company’s operations, Weiss places an emphasis on dividend yield patterns as a means of evaluating a stock.
A 2010 sequel Dividends Still Don’t Lie: The Truth About Investing in Blue Chip Stocks and Winning in the Stock Market was published in 2010.
So, what exactly is the Dividend Yield Theory?
Dividend Yield Theory says that for blue-chip dividend stocks, particularly those with a stable business model that does not fluctuate drastically, dividend yields tend to revert to the mean.
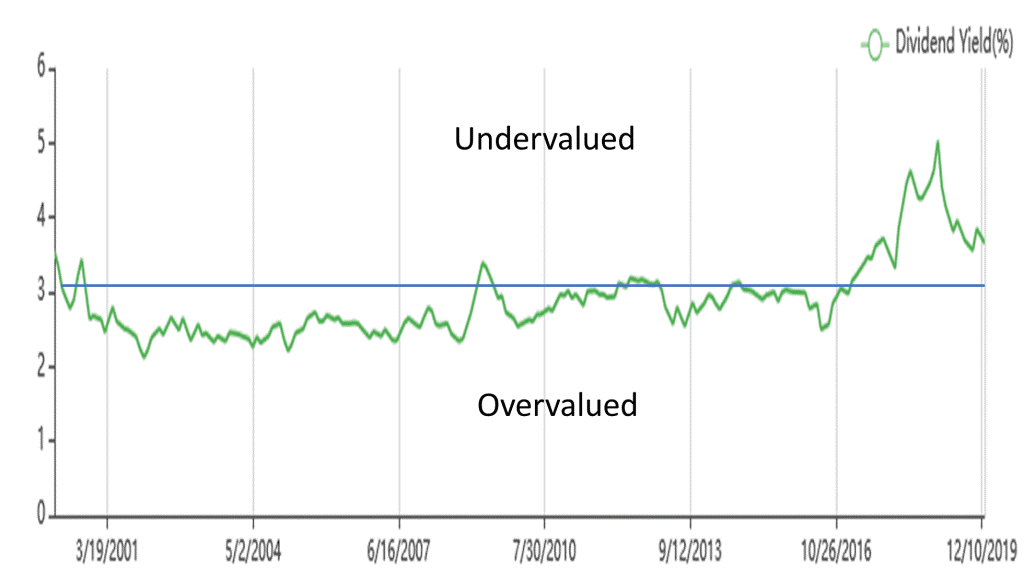
This means that if you draw a straight line right across the middle of the historical dividend yield profile of a stock, that will be its fair value. Pretty simple and intuitive. If the stock’s current yield is below its historical yield line, that represents over-valuation and if the current yield is above its historical yield line, then the stock could be undervalued.
Think of it this way. If a stock price performance is dictated by earnings (higher earnings will drive the stock higher) and dividends are in turn dependant on earnings, then one can potentially infer that stock prices could also be tracking dividends as well.
Since dividends are less volatile than earnings and are an important component of total return for a dividend stock, dividend yield can be a more stable indicator of value vs. PER.
Dividend Yield theorists believe the stock’s yield will eventually revert to its longer-term norm, assuming nothing drastic has changed about the company’s business model.
Historical Track Record of the Dividend Yield Theory
According to Mark Hulbert and The Hulbert Financial Digest, a site that tracks the performance of investment advisory newsletter since its inception in 1980, the IQT Model routinely out-performs the S&P500 as can be seen from the table below, with 15% less risk as compared to its benchmark, the Dow Jones Wilshire 5000 Total Market Index.
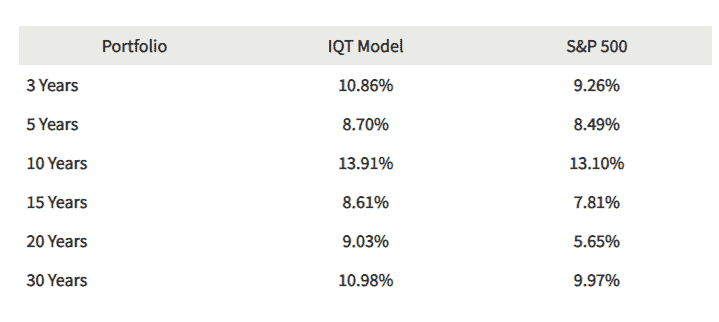
The model first looks for blue-chip stocks that meet its criteria. These stocks will achieve the designation of Select Blue Chip after it has met at least five of the six following qualifications and may remain with four criteria:
- Dividend increases 5 times in the last 12 years
- S&P Quality Ranking in the “A” category
- At least 5,000,000 shares outstanding
- At least 80 institutional investors
- At least 25 years of uninterrupted dividends
- Earnings improved in at least 7 of the last 12 years
Of the 15,000 publicly traded companies in the US markets, only approx. 350 companies meet these six criteria and of those 350, only 250-260 counters have clear-cut dividend profiles.
These stocks now fall under the Select Blue Chip category. The next step will be selecting these blue chips only when their stocks were historically undervalued (i.e. higher than average dividend yield based on historical trend), and then holding for the long term or until these counters became over-valued to warrant a sale.
Estimating the fair value of HD using the Dividend Yield Theory
One of the strong dividend-paying stocks I identified earlier is Home Depot (HD). The counter currently spots a dividend yield of 2.1% and its 5-years historical dividend yield chart is shown below.
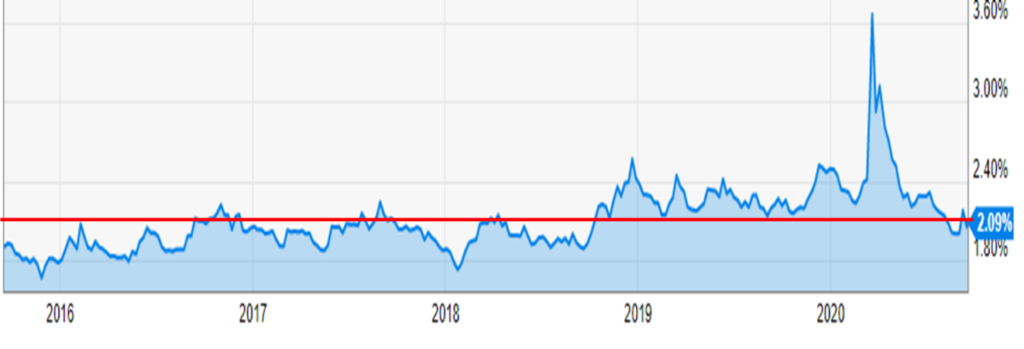
Based on a quick estimation, the counter’s average 5-years dividend yield is probably around the 2.1% level. Hence the counter is likely currently trading at its fair value based on the dividend yield theory.
Earlier in the year, its yield spiked to a high of 3.6% due to the COVID-19 driven sell-down. Its share price hit a low of $152/share before rebounding back to the current level of $279.
Assuming that the company is expected to pay a full-year dividend amount of $6/share, its fair value would be calculated as
Dividend Yield Theory Fair Value = Dividend per share / Average dividend yield (5-years)
= $6/2.1%
= $285
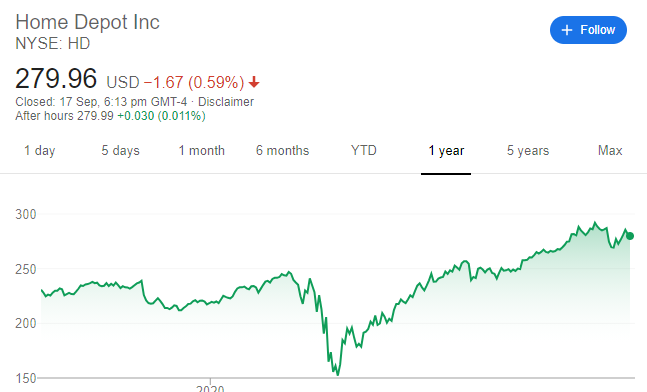
At $152/share, there is a sizable margin of safety of 47% which should have warranted an entry, assuming that HD’s operation is robust enough and does not need to cut its dividend payments.
At the current price level, there is insufficient MOS to warrant an entry in the counter.
Limitations of Dividend Yield Theory
While the dividend yield theory has been proven to be a useful valuation tool, it tends to work best under long-term conditions (> 5-years), with quality dividend stocks that possess 1) a Stable business model, 2) Stable dividend payments and 3) sustainable dividend profile.
The first point is self-explanatory. We want a blue-chip counter that is not exposed to an overly cyclical and potentially commoditized industry.
For the second point, we do not wish to see an erratic dividend payment history. For example, paying a dividend of $1 in Year 1, dropping to $0.50 in Year 2, increasing to $1.50 in Year 3, and dropping back to $1 in Year 4. We will prefer a steady increment.
Lastly, the counter needs to have a sustainable dividend profile. A growing dividend payment might not be sustainable if the payout ratio is consistently above 1 (meaning the company is paying out more in dividends than it earns). Hence, one of our screening criteria is to look for dividend counters where the dividend payout ratio is less than 1. Most of the final candidates in the list have a payout ratio of less than 0.60, which indicates safety in terms of dividend payments, with minimal risk of a dividend cut.
The Dividend Yield Theory will also not work for growth counters which do not pay any dividends or very minimal dividend payments. Growth-oriented companies will tend to re-invest their earnings to fuel further earnings growth vs. paying out in the form of dividends. Hence what will drive their share prices are earnings growth vs. dividend growth. Growth companies will be better evaluated with the PE ratio approach, which is a better valuation tool to capture the stock’s primary total return driver (i.e. earnings).
Chapter 5: How to build a dividend portfolio
You now have a better understanding of how dividend works, why dividend investing is an attractive investing strategy to help you achieve financial independence earlier, how to evaluate and identify good dividend stocks and how to find good dividend stock ideas. The only thing left is how to create a portfolio of dividend stock and see them grow over the years.
Selecting a stock brokerage
You would need to select a stock brokerage to start purchasing dividend stocks or ETFs. For US investors, there are many brokerages to choose from.
Some popular online brokerages include M1 Finance.
The M1 Finance investment platform includes both a mobile investing app and a desktop platform that is designed to make investing understandable and accessible to investors at all levels so that you can choose what dividend stocks you may want to buy with confidence. M1 Finance offers automatic dividend reinvestment so that you know that you will always be fully invested.
When you open your account, you can either customize your portfolio and choose your securities or pick from a menu of more than 80 expert portfolios that have been created to meet different financial goals, risk tolerances, and time horizons. M1 Finance allows you to invest for free. You will not be charged with any management fees or commissions.
Another popular online brokerage is Personal Capital.
Personal Capital is both a financial tracking tool and a financial advisory service. They’re also a fiduciary which means your interests come first should you decide to use their wealth management service.
Along with over 2.6m users, they also have over $14 billion in assets under management (AUM).
You can manage all of your accounts in one place, features a user-friendly dashboard, and has become the go-to in money management apps.
Creating a Personal Capital account is simple to set up and you can do it from either your phone or laptop.
You’ll start by linking your banking and investment accounts to their software and finish by completing your investor profile.
Everything is displayed on your dashboard. You’ll see your net worth, cash flow, budgeting, and portfolio balance in one place. All account balances display in real-time.
For Singaporean (and other international) investors, one can select several foreign brokerages to partake in the purchase of US dividend stocks or ETFs. I have previously written a comprehensive list of stock brokerage in Singapore where one can select to partake in the US market. A quick summary of the brokerage charges is detailed in the picture below.

For a small account (<US$50k), the selection of TD Ameritrade (which brought zero commission trading into Singapore in early August) or Tiger Brokers (a fintech online brokerage, read more about them in this review here) are the preferred choices.
The downside is that both TD and Tiger Brokers do not offer to trade in the London market, which is potentially critical for foreign investors who wish to avoid the hefty 30% withholding tax on dividend payments (more on that later).
Both Saxo and Interactive Brokers are alternative brokerage candidates to trade the London market.
Once you have selected your preferred brokerage account, you can then proceed to purchase either individual dividend stocks (based on our selection criteria in Chapter 3 or Dividend ideas from Chapter 4) or a basket of them through an ETF.
Selecting Dividend ETFs with a twist
For a new dividend investor, it might still be too much of a hassle to purchase individual dividend stocks where unsystematic risks remain elevated. Rather than selecting a handful of dividend stocks, they can choose to select a broader basket of dividend-paying stocks through a dividend-focused ETF.
The challenge with selecting pure dividend-focused ETFs is that many of them have failed to outperform over the past decade where growth stock reigns supreme. However, that does not mean they will continue to underperform in the coming decade.
Nonetheless, in our screening criteria, we identify ETFs which generate a dividend yield of at least 1.5% and have demonstrated average annualized dividend growth of at least 5% over the past 1-year, 3-years, and 5-years horizon.
We found 3 “dividend” ETFs that met the above criteria. These 3 ETFs have demonstrated outperformance over the S&P500 index over the past decade by 5-53%.
The 3 ETFs are:
- Vanguard Large-Cap Index Fund ETF Shares (VV) 1.6% yield – 4.8% outperformance over S&P500 over the past 10 years
- Invesco S&P500 Quality ETF (SPHQ) 1.7% yield – 15.8% outperformance over S&P500 over the past 10 years
- Health Care Select Sector SPDR Fund (XLV) 2.2% yield– 53.1% outperformance over S&P500 over the past 10 years
XLV looks interesting with its combination of defensive healthcare stocks as well as sporting a decent yield of 2.2%. This ETF has shown the strongest outperformance against the S&P500 over the past decade. With defensive medical + dividend growing stocks in its portfolio, the XLV ETF seems to be the ideal long-term ETF to hold for a dividend-focus investor.
Alternatively, dividend focus investors can still look to partake in a pure-dividend ETF such as the S&P500 Dividend Aristocrat ETF (NOBL) or the Nasdaq US Dividend Achievers Select Index (DVG), both of which we have highlighted earlier on. Do note that the latter has a very short operating history, listed back in Sep 2019.
For those wishing to invest in a large-cap ETF for its stability, the Vanguard Total Stock Market Index Fund (VTI) could be an alternative, with this ETF sporting a yield of 1.6% and also exhibit the dividend growth criteria required in our screening criteria. The underperformance of this ETF vs. the S&P 500 is only 3% over the past decade.
The issue with taxes for foreign investors
For non-US investors, like Singaporean investors, investing in dividend-paying stocks/ETFs will incur a substantial 30% dividend withholding tax which will substantially reduce the income potential of their dividend portfolio.
A workaround could be through investing in UCITS ETF which are non-US domiciled and hence not subjected to the hefty dividend withholding tax. An Investor can purchase these UCITS ETF, listed on the London stock exchange through brokers such as Saxo and Interactive Brokers.
Again, the issue with such a method is that the pool of available dividend focus UCITS ETFs is very limited.
The best performing Dividend-focused UCITS ETF is the Wisdom Tree Global Quality Dividend Growth UCITS ETF (GGRA LN). According to its prospectus, the Index is a fundamentally weighted index that is comprised of companies with the best-combined rank of growth and quality factors from global developed markets, selected from the WisdomTree Global Dividend Index.
The top 10 Holdings of this ETF are:
- Apple (8.18%)
- Microsoft (6.05%)
- Roche (3.29%)
- British American Tobacco (2.63%)
- Home Depot (1.97%)
- Altria Group (1.76%)
- LVMH (1.66%)
- Intel Corp (1.56%)
- Pepsi Co (1.53%)
- UnitedHealth (1.51%)
While the expense ratio of this fund is low at only 0.38%, one will need to weigh the potential higher commission cost of investing in the UK market. This will likely not be an issue for a lump-sum investor deploying a buy (annually) and hold strategy over a long horizon.
After all that is said and done, I believe a newbie dividend investor can structure his/her portfolio with a weighting of about 1/3 in a Dividend-focus ETF with the next 1/3 invested in good individual dividend growth stocks and the last 1/3 invested in REITs.
An advance strategy of purchasing dividend stocks
There are two advanced ways in which dividend stocks can be purchased using dividends, however, this strategy might not be suitable for new investors due to the usage of options as well as a potential hefty capital outlay.
However, it is an ideal strategy for a foreign investor such as a Singaporean investor to fully offset the negative impact of the 30% dividend withholding tax by engaging in these option strategies, assuming that he/she has the appropriate capital in place.
Selling Put Options to purchase dividend stocks with a margin of safety
In our earlier example, I have highlighted that Home Depot is currently fairly valued, trading at a price of USD$280/share which is pretty close to the calculated fair value of USD$285/share using the Dividend Yield Theory.
An investor might be attracted to the defensive nature of HD stock as well as the decent yield of 2.1% it is currently paying, with the potential for this dividend to grow at a rate of 16% over the coming year. However, he/she will like to have a 20% margin of safety, ie to purchase HD stock only when it is priced at USD$230/share.
Instead of waiting for such a scenario to happen (which might or might not happen), the investor can choose to sell a PUT Option on the stock and collect a premium in the meantime. By Selling a “Cash Secured” Put Option with a Date to Expiry of 19 Feb 2021 (154 days) and strike price of USD$230, the investor can generate an income of USD$625 while waiting for HD to hit his required price of USD$230/share.
If the price dips below USD$230 on expiration, he is happy to acquire HD stock at USD$230/share. If it doesn’t, he gets to pocket the full USD$625 premium which translates to an annualized yield of 6.4%.
Selling Covered Call Options to further juice up the dividend potential of a stock
On the other hand, if a dividend investor already owns 100 shares of a stock, he can further increase the stock’s “dividend” potential by selling a covered call option on it.
My favorite example is Philip Morris, a stock that I have written about on several occasions, one which a foreign investor (ie Singaporean investor) need NOT pay a 30% dividend withholding tax on and thus get to enjoy the full 6% yield which the stock currently accrue.
If one already owns 100 shares of Philip Morris, he can choose to sell a covered call option on it. Say, for example, he purchased 100 shares of Philip Morris at a price of USD$70/share. At that cost, the yield potential is 6%. He can choose to sell a call option at a strike price of $90 (what he determined as the fair value of the stock) over 273 days which will net him a premium of $229.
Assuming that his stock is not called away, ie stock price not above US$90/share after 273 days.
Total potential annualized yield = 229/7000/273*365 + 6% = 10.4%.
In this case, by generating additional income from the covered call strategy, he can increase his dividend yield from an already attractive 6% to one which is at 10%.
Summary
In Chapter 1, I introduced the concept of dividend investing and how when done properly, could help one to achieve financial freedom earlier. Using a simple illustration, I demonstrated that a disciplined contribution of $12k every year between you and your spouse could translate to a hefty portfolio amount of S$2m when you retire after 30 years and the passive income generated from dividends can help sustain your retirement for the rest of your life (assuming you are not into buying bungalows and Lamborghinis).
In Chapter 2, I introduced the basics of dividends. What are they, the different types of dividends, special dates to note on dividend payments, etc as well as the type of dividend stocks you can expect in different industries.
In Chapter 3, I highlighted the traits that make good dividend stocks, starting with the 3 tenets of dividend investing, followed by the 7 Golden Rules to adhere when it comes to dividend investing, the 8 key important financial ratios to note when it comes to selecting dividend stocks and lastly, the presence of any of the 4 economic moats to ensure that the company has a competitive edge over its peers.
Knowing the traits of a good dividend stock is one, having the resources to find them is another. In Chapter 4, I show you exactly where you can find strong dividend stock candidates. I created a NAOF dividend blue-chip portfolio consisting of the strongest dividend growers (10 of them) and how to value them using the Dividend Yield Theory concept.
In Chapter 5, I show you how you can put your newfound knowledge on dividends into action by building a dividend stock portfolio. Starting with the selection of a stock brokerage followed by what a dividend portfolio should look like for a newbie dividend investor. I proceeded to demonstrate some advanced level of purchasing dividend stocks using Put options as well as how you can further “juice-up” the dividend potential of your stocks using call options.
Conclusion
This is a very detailed ultimate guide on how to invest in dividend stocks which a new investor can replicate the step-by-step approach to start investing in a portfolio of dividend stocks/ETFs. The benefits of dividend investing are clear, particularly when it comes down to supplementing one’s retirement expenses.
By starting his/her dividend journey early, one can reap the full benefits of compound interest working for you. As I have demonstrated in Chapter 1, the difference between reinvesting the dividends in a portfolio with an annualized yield of 4% (growing at a rate of 5% annually) and not doing that is a hefty 1.1m difference.
That is the power of dividend investing in action. Now it is your turn to take action and secure your financial future starting from today.
Do Like Me on Facebook if you enjoy reading the various investment and personal finance articles at New Academy of Finance. I do post interesting articles on FB from time to time which might not be covered here in this website.
Join our Telegram broadcast: https://t.me/gemcomm
SEE OUR OTHER WRITE-UPS
- DIVIDENDS ON STEROIDS: A LOW-RISK STRATEGY T10 GREAT REASONS TO BUY REITS AND 3 REASONS TO BE CAUTIOUS [UPDATE 2020]
- HOW TO BUY REITS IN SINGAPORE. 10-KEY S-REIT QUANTITATIVE FILTER (PART 1)
- WHY I AM STILL BUYING REITS EVEN WHEN THEY LOOK EXPENSIVE
- HOW TO BUY REITS IN SINGAPORE. 8 ADDITIONAL FACTORS TO CONSIDER (PART 2)
- THE BEST PREDICTOR OF STOCK PRICE PERFORMANCE, ACCORDING TO MORGAN STANLEY
- BEST PERFORMING SINGAPORE REITS AMID CURRENT MARKET VOLATILITY


