

Table of Contents
Where might the S&P 500 be 10 years from now?
We have been told umpteen times by financial gurus that the market’s long-term price trajectory is one single direction: UP.
But what if they are wrong? In this article, I look to detail a possible scenario by which the market might be “almost” flat 10 years from now, as scary as it might be, and why a passive investing approach will no longer be as effective from hereon.
But first, what are the 5 factors that drove the S&P 500’s massive 16.6% annualized return over the past decade?
Key Factors 1 & 2: Sales & Margin growth
Some of you might not be aware that 1 key factor has had a strong correlation with the market’s performance. That factor is earnings growth
Higher earnings will be rewarded with a higher share price. Make sense.
Now, if we are to drill down into the nitty gritty, earnings growth can be further broken down into 2 distinct components:
Component 1: Sales Growth
Component 2: Profit Margin Growth
Earnings Growth = Sales Growth + Profit Margin Growth
To generate stronger earnings growth, a company has to demonstrate either sales growth or profit margin growth, or a combination of the two.
Earnings can grow as long as one of the two factors is present. If the company can boost sales even with a flat profit margin, earnings can grow.
On the other hand, if the company fails to grow sales but can achieve greater operational efficiency by boosting its margins, earnings can also grow.
The best scenario for a company is to generate both sales and margin growth. That will “supercharge” its earnings growth.
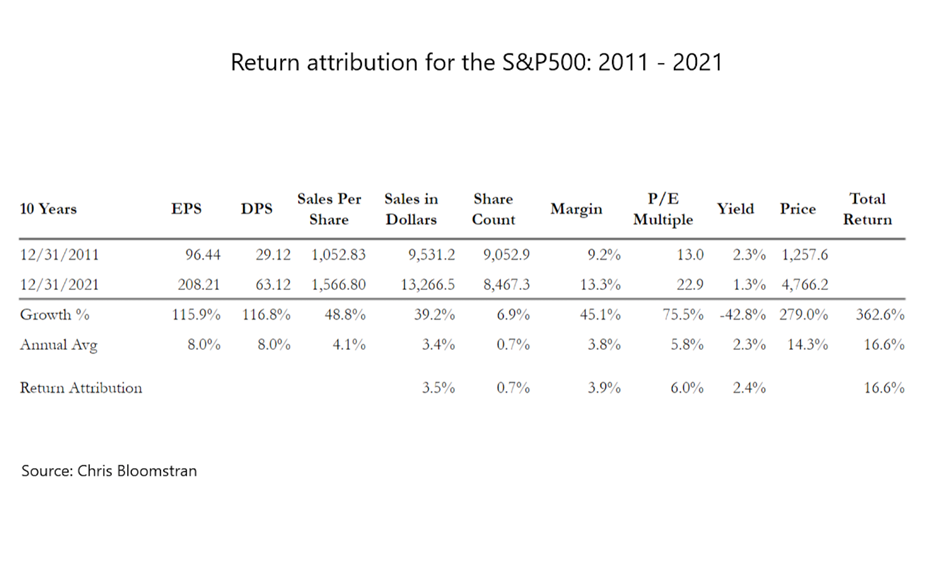
Over the past decade, a combination of sales and profit margin growth has contributed to almost 7.5% annualized return in the S&P 500, according to data from Chris Bloomstran (more on this later)
Key Factor 3: Share base reduction
Earnings Growth vs. EPS Growth
To calculate EPS growth from earnings growth, we need another bit of data.
Some of you would know that the EPS figure or earnings per share, is derived by dividing a company’s earnings by its outstanding share base
EPS = Earnings/Share base
Now, a company could look to boost its EPS by simply reducing its share base, even if earnings remain constant.
Hence, when we look at EPS growth, in addition to both sales and margin growth, we will also need to account for a company’s decline in outstanding share base.
EPS Growth = Sales Growth + Profit Margin Growth + rate of decline of share base
For example, if a company is generating annual sales growth of 5%, profit margin growth of 5%, and reducing its share base by 10%, then the company’s EPS growth can be simplified as such
EPS growth = 5% (Sales growth) + 5% (Margin growth) + 10% (share base reduction) = 20%
The actual EPS growth is slightly higher at 23%, but we will simplify the equation as such.
This will be our 3rd factor. Share base reduction has contributed to approx. +0.7% annualized return to the S&P 500 over the past decade.
Small but still a contributor. For a company that has been aggressively buying back shares, this is one key factor that can result in substantial EPS growth.
Key Factor 4: P/E multiple
The 4th factor is P/E multiple. While the above 3 factors can all be controlled by a corporate, this 4th factor is typically “sentiments” driven and cannot be directly controlled by the corporate.
The market might feel “bullish” one day and accrue a high P/E multiple to a company, and yet bearish the next moment and drive down that P/E multiple.
Over the past decade, characterized by a low-interest rate environment, Mr. Market has been particularly generous by accruing a higher-than-average P/E multiple (>20x) to the market.
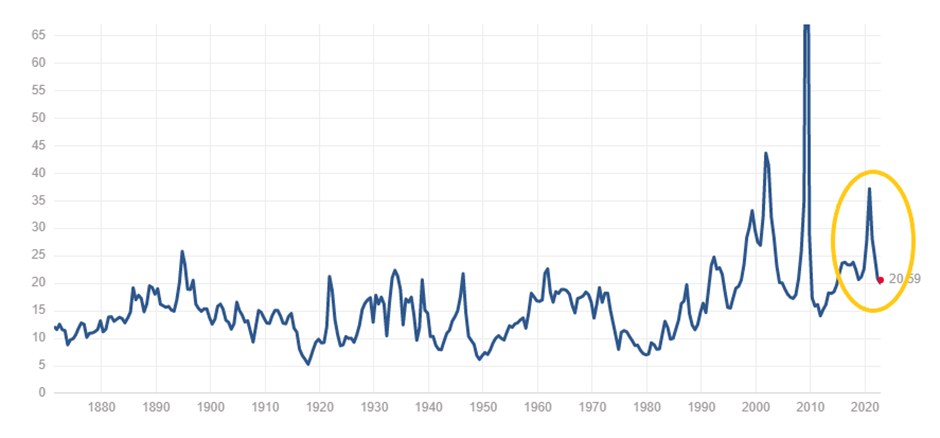
This “expansion” in P/E multiple alone contributed approx. +6% in annualized return for the market.
That is massive and might not be recurring in the current hawkish environment with interest rates heading higher by the day.
Key Factor 5: Dividend Yield
The 5th and final factor is Dividend Yield and this historically contributed about 2.4% annually to the market returns.
Based on data from Chris Bloomstran, the S&P 500 16.6% annualized return over the past decade is contributed by the following 5 factors:
Sales growth (3.5%) + Margin growth (3.9%) + Share reduction (0.7%) + P/E expansion (6.0%) + Dividend Yield (2.4%) ~ 16.6%
What is going to happen in the next 10 years?
No one has got a magical crystal ball to say with absolute certainty.
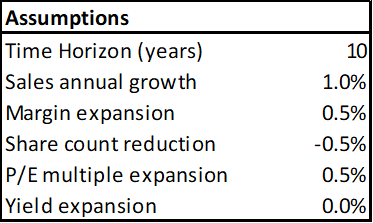
I am making a few assumptions over here to try to fathom a guess as to where the S&P 500 might be trading 10 years from now.
Assumption 1: Annualized sales growth at +1.0%/annum (vs. 3.4% historically)
Assumption 2: Margin growth of +0.5%/annum (vs. 3.8% historically) as corporates struggle with the effect of inflation
Assumption 3: Share count reduction remains constant (as per the past decade) at +0.5%/annum
Assumption 4: P/E multiple at 18.1x which is in between the 5 and 10 years average historical P/E multiple of 17.5x & 20x respectively
Assumption 5: Dividend yield at 1.9%
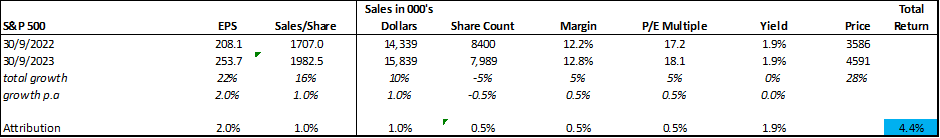
Using these 5 key assumptions, my magical crystal ball is predicting that the S&P 500 will be at 4,591 in 10 years.
This translates to an annualized return of 4.4% (accounting for a 1.9% yield) for the average passive investor, which is a far cry from the 16.6% that investors used to enjoy a decade ago.
Generate higher returns through superior stock selection
To generate superior returns, the easy solution of “sticking” to the index might no longer be relevant in the next decade.
Instead, an investor will need to take more risk by finding superior stocks that exhibit some or all of these 5 key factors mentioned in this article.
This is what the Stock Alpha Blueprint Course aims to achieve. For readers who are interested to find out a simple solution to screen for high-quality, market-leading stocks that can generate strong outperformance over a medium to long-term horizon, stocks which I termed as my Alpha Blueprint Stocks, do check out the link below:
Conclusion
The S&P 500 generated a robust 16.6% annualized return over the past decade. That might no longer be achievable. Instead, based on my “guestimate”, the annualized return over the next decade might just be a paltry 4.4%.
For investors looking to generate superior returns, one would need to look at a selected breed of stocks which I termed Alpha Blueprint Stocks. These are market-leading stocks that have a strong track record of historical outperformance (~+20% annualized returns) and one can be assured that they will continue to do well even in a recessionary environment.
Check out the link below for more details
Do Like Me on Facebook if you enjoy reading the various investment and personal finance articles at New Academy of Finance. I do post interesting articles on FB from time to time that might not be covered here in this website.
Join our Instagram channel for more tidbits on all things finance!
Join our Youtube channel for short and sweet videos on all things finance!
SEE OUR OTHER WRITE-UPS
- GUIDE TO SYFE AND HOW TO OPEN AN ACCOUNT IN LESS THAN 10 MINUTES
- SYFE GUIDE: DID SYFE’S ARI ALGORITHM OUTPERFORM IN TODAY’S MARKET VOLATILITY?
- Pricing Power: Stocks that can do well amid inflation concerns
- 5 Small-Cap US Stocks with 10 years of consecutive earnings growth
- How to invest in Dividend stocks
- 9 Strong Free Cash Flow Stocks that you need to own
Disclosure: The accuracy of the material found in this article cannot be guaranteed. Past performance is not an assurance of future results. This article is not to be construed as a recommendation to Buy or Sell any shares or derivative products and is solely for reference only


