In this ultimate guide to REITs in Singapore, I will be providing comprehensive coverage of all things REITs here in sunny Singapore, ending the article by identifying top REITs in Singapore to buy today based on three different methods.
Introduction
The REIT sector has been extremely volatile of late due to the COVID-19 pandemic issue that has thrown the world’s economy into a tailspin.
While REITs have traditionally been a relatively steady investment asset even during recessions (except the 2008-2009 GFC), the current environment is one that is seemingly unprecedented with global economies in a shutdown mode. REITs, as an investment class, have not been spared the carnage.
Is there still an investment thesis?
This will be an extremely long article (almost 15k words) providing you with total coverage of REITs here in Singapore, hence you might want to sit back and enjoy with a cup of coffee in your hands. I will break down this guide to REITs in Singapore into 4 sections as follow:
Section 1: Basics of REITs
- What are REITs?
- Why buy REITs?
- Glossary of REIT terms
- REITs fee structure
- Types of REITs in Singapore
Section 2: Current REITs environment
- Are REITs expensive in today’s environment?
- New measures to help REITs navigate the current challenging environment
- Outlook of KEY REIT industry
Section 3: How to buy REITs in Singapore
- 10 Quantitative screening filters
- 8 additional Qualitative factors to consider
- Investing in REITs through ETF
- Investing in REITs through Robo Advisors
Section 4: Top REITs counter to BUY today
- Selecting REITs using our REIT comparison table
- Selecting REITs based on Price fall relative to 2020 DPU decline
- Selecting REITs based on the street recommendation and TP
Without further ado, let’s jump start to this Ultimate Guide to REITs in Singapore
Section 1: Basics of REITs
What are REITs?
A real estate investment trust or REIT is a company that owns, operates, or finances income-generating real estate such as shopping malls, offices, hotels, and industrial properties. REITs pool the capital of numerous investors like you and me, making it possible for the man-in-the-street to become a property landlord (regardless of how tiny our stake might be) and earning recurring dividends from these property assets, all without the hassle of buying, managing and financing physical properties themselves.
Assets of REITs are professionally managed and revenues generated from assets are distributed at regular intervals to investors (normally every quarter).
Units of REITs are bought and sold on the stock exchange like other listed securities at market-driven prices. Investors of REITs generate income from the dividends (or more commonly termed as distributions) that REITs declare. Since they are “mandated” to dish out at least 90% of their taxable income, there is often a high level of visibility on the income generated from REITs.
The primary object of owning REITs is thus to generate a stable, sustainable dividend yield.
Since REITs are listed investment assets like stocks, in addition to the dividends that they declare, an investor can also generate capital gains if REIT prices appreciate. REITs have over the past 2 decades outperform all asset classes on a Total Return basis (Dividends + stock price appreciation).
Why buy REITs?
REITs vs. Physical properties
REITs are a more fuss-free option to own a property compared to being a physical landlord. The table below summarizes the key differences between buying REITs and buying physical properties.
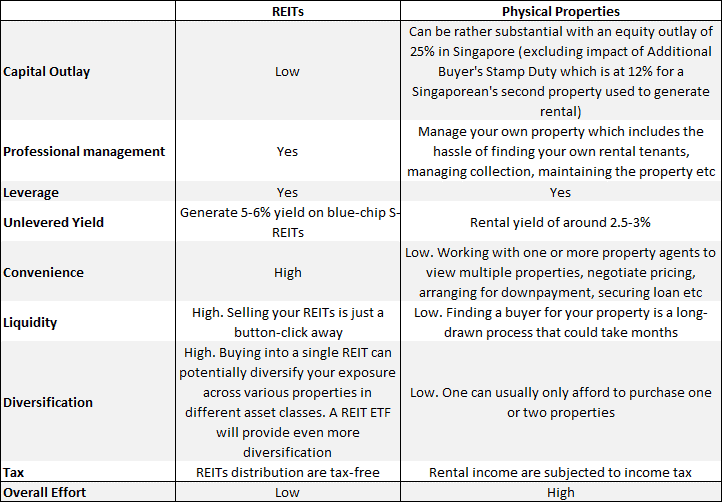
It is interesting to note that the residential property market in Singapore remains relatively “resilient” amid the stock market mayhem. How long might that last? Industry experts believe that residential sales should remain robust and no one currently expects a significant price decline, unless if unemployment spikes significantly. Even then, the government can still remove the cooling measures.
EdgeProp has made a brief observation of the property market in Singapore which you can find the article here. While purchasing REITs is still a low-level effort to become a “property owner” compared to purchasing physical units, the recent price roller coaster might not be for the weak-hearted.
REITs are high-yielding assets paying 5-6% yield on average
A key reason why REITs in Singapore are so popular is due to their high yielding nature. REITs, in general, are required by law to redistribute at least 90% of their taxable income each year to their unitholders to enjoy tax-exempt status by the tax authorities. This is a key reason why they can offer investors a regular and predictable income stream, with an average of 5-6% dividend yield.
The recent unprecedented hit to global economies due to COVID-19 has impacted the operating environment of REITs significantly, particularly hospitality and retail REITs where the dearth of tourists and the forced closure of many non-essential shops in retail malls have greatly impacted the ability of these REITs to generate income. To help REITs to operate this challenging environment, the Monetary Authority of Singapore has come out with a slew of new measures to help REITs navigate this current challenging environment. I will talk more about this in Section 2 of this guide to REITs in Singapore but let me just briefly highlight the 90% rule here.
Previously, REITs have up to 3 months from the end of their financial year to distribute 90% of their taxable income. This is now extended to 12 months. For example, a REIT with their FY2020 ending as of 31 March 2020 can now pay 90% of their taxable income by 31 March 2021 instead of the original deadline of 30 June 2020.
REITs provide good diversification to your portfolio
REITs have historically provided investors an efficient way to diversify their investments to reduce risk and increase long-term returns. REITs, as a distinct asset class, have demonstrated a low-to-moderate correlation with other sectors of the stock market as well as bonds and other assets.
In other words, REITs returns have tended to zig while returns of other asset classes have zagged, smoothing a diversified portfolio’s overall volatility.
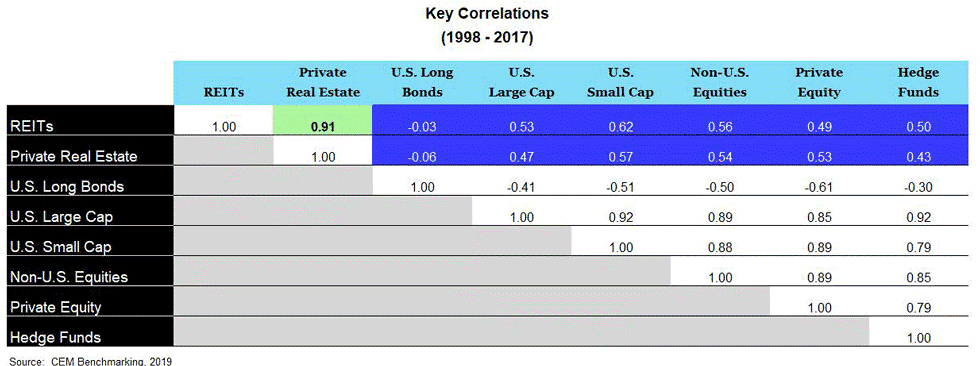
As can be seen from the table above, the correlation factor of REITs to most major asset classes are around 0.50.
It might seem in this current 2020 market sell-off that the impact on REITs has been much more significant compared to stocks. This is puzzling to me as I believe that REITs fundamentals, in general, remain sound, though a tad over-valued before the recent sell-off. Yes, there will be a major impact on certain industries like the high-end retail and hospitality segments. However, the indiscriminate selling across all industries can only be explained by the rush for CASH.
As of this writing, the REIT industry has pared its losses. I will provide more details on the current REIT environment in the next section.
REITs tend to be a good inflation hedge
REITs provide natural protection against inflation because it is a vital and tangible asset to our society. With the printing presses around the world going out of control, owning a tangible asset (which cannot be easily “printed”) with limited supply will allow one to sleep well at night – knowing that they will always be valuable.
According to Ascendas REIT, they believe a key benefit of REITs is that they provide a natural hedge against inflation. When inflation rises, the value of real estate and real estate securities are expected to increase as well. REITs thus can be considered as a substitute for a fixed income portfolio during periods of expected and high inflation.
In Singapore, some REITs have fixed rental escalation clauses while others have a rental escalation that is pegged to the consumer price index. S-REITs are generally shorter-term in nature (approx. 3 years) and this will allow landlords greater flexibility to re-price rents to market rates more often which serves as a decent inflation hedge.
Inflation risk at the moment remains benign here in sunny Singapore but do not underestimate its risk. If inflation does materialize, it will be in the form of stagflation based on the current context where Singapore is expected to be already in a recession.
Hence, there will be little scope for REITs to raise their rentals. That will be a major “de-catalyst” for REITs to sell-off big time as that might mean that interest rates will be forced to rise, increasing their interest costs. At the current moment, we are mindful of stagflation risk but it is not yet evident that this phenomenon will present itself over the coming months.
Competitive long-term performance
REITs are a total return investment, typically providing current income with the potential for long-term capital appreciation. Public REITs have a long-term track record of enhancing returns (evidenced by the chart below).

From 2000-1H19, US REIT generated an annualized return of 11.1% while global REIT generated a return of 10.6%. REITs as an asset classed has outperformed equities and bonds during this period.
There are probably many other good reasons to buy REITs which I highlight in this article: 10 Great Reasons to Buy REITs and 3 Reasons to be Cautious (Update 2020). Do take a read.
Glossary of REIT terms
Accretive Acquisition: Also known as “yield-accretive acquisition”, an accretive acquisition is the purchase of an asset that leads to an increase in the acquirer’s distribution per unit (DPU).
In most M&A, the acquirer REIT will use a combination of debt and equity to fund the acquisition. For the acquisition to make sense, it has to be accretive or result in the increase in DPU. The opposite of an accretive acquisition is a dilutive acquisition.
Average interest cost: The average interest cost of a REIT measures how expensive their borrowings are. This is an important factor for REITs as they are leveraged products and ultimately depend on a high level of borrowings to fund their property acquisitions.
That is why REITs generally benefit in a low-interest-rate environment like the current one. However, there might be instances where the operational profile of a REIT has deteriorated such that their credit rating is being downgraded by one of the rating agencies. In such a scenario, the REIT might find that their interest cost has increased even though the overall macro environment remains in a low-interest rate regime.
Aggregate Leverage/Gearing: Another important factor that has often been scrutinized is the aggregate leverage or Gearing profile of the REIT. This is simply defined as:
Gearing = Total Debt / Total Assets
When evaluating REITs, the denominator in this equation is generally total assets while Gearing for “non-REITs” companies, the denominator is usually total equity.
Since 2015, MAS has imposed a gearing limit of 45% for all REITs. This limit has recently been increased to 50% due to the COVID-19 issue.
Base Fee: This is a fee that the REIT pays to its REIT manager regardless of the performance of the REIT, generally in the range of 0.25-0.5% of the total assets of the REIT. This could result in a conflict of interest between REIT managers and shareholders as REIT managers will be “incentivized” to grow total assets under management, possibly through new acquisitions even though the acquisitions might not be favorable or an accretive acquisition.
Capital Expenditure or CAPEX: Capex refers to the cost incurred to acquire, maintain, or upgrade assets such as property, plant, and equipment (PPE). These could include asset enhancement initiatives or AEI to refurbish the properties.
A nicer looking property with better amenities will attract more tenants and ultimately result in a higher rental price.
Capitalization Rate: The capitalization rate or cap rate for short, is defined:
Cap rate = Net Operating Income / Purchase Price.
The higher the purchase price, the lower the cap rate and vice versa. When buying a property, the acquirer will prefer a higher cap rate which indicates higher potential returns. On the other hand, when selling a property, the seller will want to push for a low cap rate as that will mean a higher purchase price for its property.
Cost of Capital: This is the cost to the REIT for raising capital in the form of equity and debt.
Cost of Capital = X% * cost of equity + Y% * cost of debt (where X and Y represent the percentage of funding by equity and debt respectively).
The cost of equity generally includes both the dividend rate and the expected equity growth rate while the cost of debt is the interest cost on the debt incurred (as we have previously explained under “average interest cost”).
Distributable Income: This is normally calculated from “Income available for distribution” which we will explain below. In theory, a REIT’s distributable income needs to be at least 90% of its income available for distribution to enjoy tax-exempt status.
However, in today’s context, many REITs in Singapore are choosing to pay out only 30-50% of income available for distribution as their distributable income due to COVID-19. This is to build up its reserve in anticipation of a deterioration in its operating environment ahead.
This will be covered in more detail in Section 2.
Distribution per Unit: This is the amount of dividends a REIT investor receives for every unit he has.
DPU = Distributable income / Total Number of Units outstanding.
In some sense, DPU is even more important that distributable income. This is because distributable income can increase as a result of property acquisition. However, if the acquisition is funded by equity, which increases the total number of units outstanding, the resulting DPU might be lower vs. pre-acquisition as the rate of distributable income increase is lower than the rate of increase in units outstanding.
This happens when the acquisition is dilutive.
Distribution Yield: Also known as the yield on cost.
Distribution Yield = DPU / cost of each unit of REIT on an acquisition. The higher the distribution yield, the more attractive is the REIT.
Gross Revenue: This is the total revenue collected from all of a REIT’s portfolio of assets which include gross rental income, car park income, and other miscellaneous income.
Income Available for Distribution: This is generally calculated as net income + other non-cash components such as depreciation and amortization, future income tax expenses, and gain/losses in the revaluation of the property – sale gain from the property.
This is one of the key components that an investor will track when evaluating the attractiveness of the REIT. This is similar to the term funds from operation or FFO which is very commonly used in the US to define the cash flow from their operations.
Net Asset Value (NAV): This is simply the book value of the REIT.
NAV = market value of all assets less all liabilities and obligation.
Net Property Income (NPI): This is the amount that measures the property’s profitability after deducting property expenses such as property manager’s fee, property tax, maintenance expenses, and other property expenses.
Net Property Income = Gross revenue – Property Expenses
Do note that net property income (NPI) is different from net income as we still need to deduct other non-property related expenses such as borrowing costs and REIT managers fee to derive net income from NPI.
Occupancy Rate: The occupancy rate measures the proportion of the lettable area that is occupied by a tenant. If a REIT has a 100% occupancy rate, it means that all its properties are fully leased out.
A 100% occupancy rate is rare but a handful of REITs can have a relatively high occupancy rate of 95% and above. A high ratio tends to indicate that the properties are highly desirable and sought after. This can, however, prove to be a double-edged sword in a booming market where rental rates are on the rise.
A property with close to full occupancy rate will not be able to benefit from higher rental leases.
Property Yield: This is often defined as the net property income (NPI) from all properties / Total value of the property. A high ratio tends to indicate that the property/properties are potentially “undervalued” and more desirable.
This is similar to the distribution yield. A high distribution yield is more desirable than a low distribution yield.
REIT Manager/management fee: The REIT manager is like the fund manager of the REIT and they tend to make investment decisions such as acquisitions and divestments of properties on behalf of unitholders. They are also the ones to hire the property manager who is like the facilities manager in charge of maintaining and operating the properties.
Property manager fees are expenses used to calculate NPI from Gross Revenue. REIT manager fees are non-property expenses used to calculate net income from NPI. More information on this when we discuss about the REITs fee structure.
Rental Reversion: This is a metric used by REITs to show whether new leases signed have higher or lower rental rates than before.
Unfortunately, there is no standardization across the industry as to how rental reversion is being calculated. A +5% rental reversion by Keppel REIT, for example, is different from a +5% rental reversion by Frasers Commercial Trust.
We will discuss more about this factor in section 3 where we highlight the 8 additional qualitative factors to consider when buying a REIT.
RevPAR: Revenue per Available Room is a metric used in the hospitality industry to measure the average amount of a hotel makes per room.
RevPAR = Hotel’s total revenue from rooms available / Number of days being measured
Sponsor: This is like the parent of the REIT, the one that previously owns the properties in the REITs and has now “monetized” them by injecting the properties into a REIT. They may continue to provide a pipeline of assets for the REITs. The sponsor tends to own stakes in the REIT manager and the REIT itself.
Having a strong sponsor is important for the REIT as it provides future growth visibility. In certain cases where the sponsor is also the master lessee of the REIT, a strong branding + credit rating of the sponsor will give investors of the REIT confidence that there is a high level of revenue visibility.
Triple Net Lease: A lease agreement where the tenant agrees to pay real estate taxes, property insurance, building maintenance costs, and utility expenses in addition to their monthly rentals. Such an agreement is usually beneficial to the REIT as the REIT no longer needs to bear the operating costs of running the property.
However, investors should pay particular attention to REITs where such triple net leases are derived from the sponsor. This could be a method to increase the property values when these assets were injected into the REITs, thereby benefitting the seller/sponsor.
Weighted Average Lease Expiry (WALE): This is used to measure the length of the property leases. In general, a long WALE is preferred over a short one as they provide a higher degree of revenue visibility over the medium-term. A property with a short WALE might experience “lumpiness” in terms of occupancy rate as it takes time to find new tenants if the lease is not being renewed.
There are two ways to calculate WALE, either by net lettable area (NLA) or Gross Income.
Using NLA:
Property #1: 30% of area expiring in 5 years
Property #2: 70% of area expiring in 10 years
WALE (NLA) = 30% X 5 years + 70% X 10 years = 8.5 years
Using Gross Income:
Property #1: 40% of gross rental income with 4 years of remaining lease term
Property #2: 60% of gross rental income with 8 years of remaining lease term
WALE (Gross Income) = 40% X 4 + 60% X 8 = 6.4 years
REITs fee structure
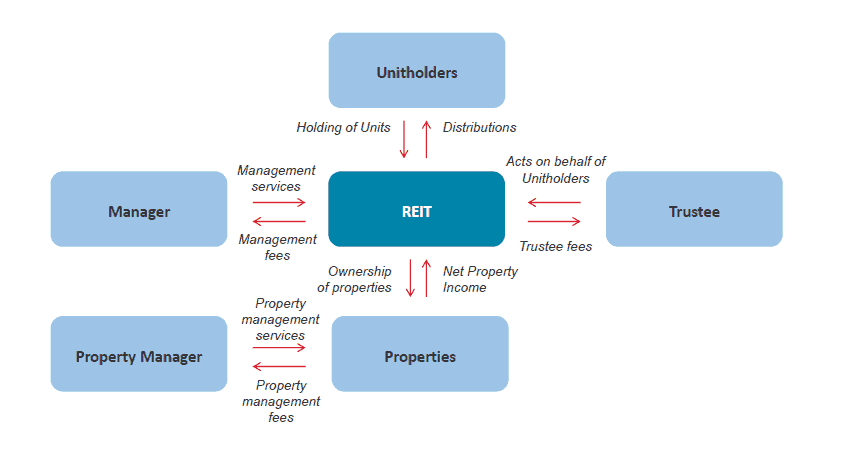
There are mainly 3 fee structures in a REIT. 1) Property Manager fees, 2) REIT manager fees, and 3) Trustee fees.
Property Manager: A property manager is typically appointed by the REIT manager to manage the underlying real estate properties of the S-REIT. It oversees renting out the property to achieve the best tenancy mix and rental income, running marketing events or promotional programs, and upkeep the property in general. In exchange, the Property Manager is paid a property management fee out of the assets of the S-REIT.
Expenses for the Property Manager is recorded before the Net Property Income (NPI) line. This information might or might not be separately disclosed by the REITs.
Typical property manager fees amount to 2-3% of gross revenue.
REIT Manager: S-REITs’ assets are externally managed by a REIT manager. The REIT manager is responsible for managing the S-REIT, setting, and executing the strategic direction of the REIT per the S-REIT’s stated investment strategy.
This includes the acquisition and divestment of the underlying properties. In exchange for its services, the REIT manager charges a management fee that includes a base fee and a performance fee. It may also charge additional fees such as acquisition and divestment fees.
Base fee: The base fee is usually calculated as between 0.25% to 0.5% of the property value (method 1). This is likely the common metric adopted by most REITs. Method 2 is to price the base fee as a % to distributable income. This percentage is usually approx. 10% of distributable income.
Calculating the base fee as a % of the property value (method 1) could result in a conflict of interests between unitholders and management. That’s because if management is paid based on the size of a REIT’s assets, then it has an incentive to grow the REIT as large as possible to maximize its payment.
This can result in a REIT chasing after “growth at any price”, buying properties when the dynamics might not be favorable. Ultimately, this will translate to a higher share count base (as the REITs will likely adopt partial equity raising) but a potentially lower NAV.
Performance fee: This is a variable component that might or might not be paid, depending on if the REIT can achieve a certain degree of growth.
The performance fee is calculated as a % based on growth in 1) Gross Revenue, 2) Net Property Income (NPI), 3) DPU, and 4) Property value (assuming DPU growth of 2.5% YoY).
Point 1 and 2 calls into question of potential conflict of interest as we previously highlighted while Point 3 and 4 are more aligned with unitholders’ interest.
The Straits Times, back in 2015, have also pointed out this issue in this article, highlighting that MAS would like the REIT manager’s performance fee to be linked to parameters such as the net asset value per unit (an accretive acquisition will raise the NAV over time) or the DPU paid out to investors.
Acquisition and divestment fees: There are 2 other fees, mainly acquisition and divestment fees which range between 0.5%-1% of a property transaction.
Trustee: The trustee is responsible for holding assets on behalf of the S-REIT and represents the interests of the unitholders. Its duties include ensuring compliance with all appliable laws, taking custody of the real estate assets, and protecting certain rights of unitholders.
While not often mentioned in the same light and importance as a REIT manager, a trustee job is critical when a dispute arises, as can be seen from the Eagle Hospitality REIT saga. The trustee, in this case, DBS Trustee, becomes the gate-keeper where any payments or transfer of funds from Eagle Hospitality REIT has to be first approved by DBS Trustee before they can be transferred out.
DBS Trustee is also required to set out the actions it will take to protect the interests of the unitholders.
Trustee fees typically amount to 0.01% to 0.1% of assets.
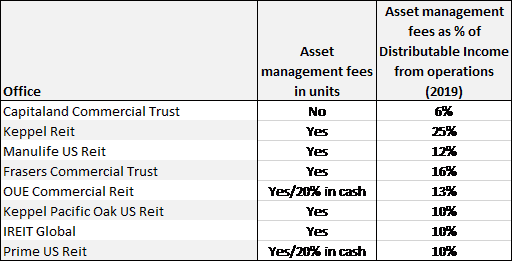
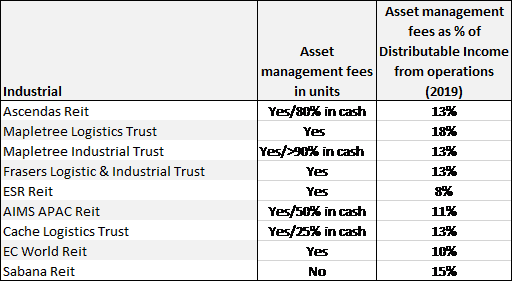
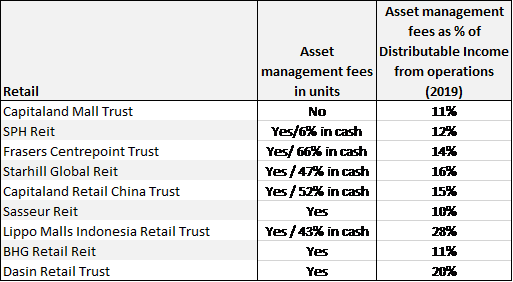
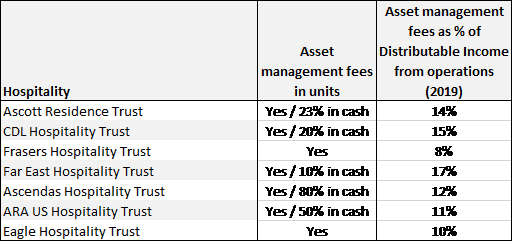
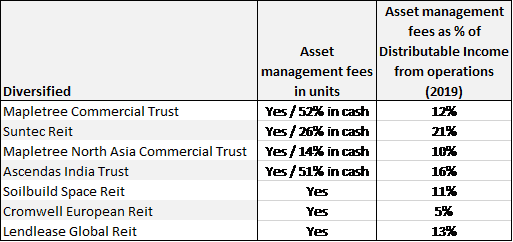
I have written an article: Are you overpaying your REIT manager? Which S-REITs have the highest management fees? The conclusion is that most REIT managers’ compensation scheme is typically about 10-15% of the distributable income. However, there are some such as Suntec REIT (21%), First REIT (29% – could be due to overseas structure), Lippo Malls (28% – could be due to overseas structure) and Keppel REIT (25%) which are on the high end of the spectrum.
The tables below provides a summary of the S-REIT manager fee structure and how they are being paid.


Types of REITs in Singapore
Reits in Singapore are generally classified as an office, retail, industrial, healthcare, hospitality, data center, and diversified.
#1 Office REITs
These are the REITs that focus their investments in office buildings and they generate income from renting office space to their tenants.
CapitaLand Commercial Trust is currently the largest office REIT in Singapore with a market cap of S$6.2bn. The REIT has announced its proposed merger with CapitaLand Mall Trust to form a new entity called CapitaLand Integrated Commercial Trust which is expected to become the biggest REIT in Singapore when completed sometime in end-1H20.
#2 Industrial REITs
Industrial REITs own and manage industrial facilities such as warehouses and distribution centers and leases these spaces out to tenants.
The biggest industrial REIT currently is Ascendas REIT, which is also the largest REIT by market capitalization in Singapore currently at S$10.8bn. The counter has been one of the better performing S-REIT amid the COVID-19 led sell-off due as the industrial sector is seen to be more resilient as compared to other sectors.
We will provide more information on the individual REIT industry sector outlook in the next segment.
#3 Retail REITs
Retail REITs generally own shopping malls here in Singapore. They generate income by renting retail/shopping space out to its tenants. If tenants are having trouble due to weak footfall, they may run into cash flow problems and not be able to pay their rents.
Retail REITs can also be differentiated by the type of retail malls they own. Are they high-end shopping malls at Orchard or sub-urban malls situated in your neighborhood?
CapitaLand Mall Trust is currently the largest retail REIT in Singapore with a market cap of S$7bn. As highlighted, the REIT is to be merged with CapitaLand Commercial Trust, with the enlarged entity holding a combination of both office and retail assets.
#4 Healthcare REITs
Healthcare REITs own and manage various types of healthcare properties such as hospitals, nursing homes, and medical centers. They tend to also have a master lease structure from their sponsor which is great in the sense that it provides strong revenue visibility. However, on the flip side, if credit issues of their sponsors are to surface, the REIT might also be sold off.
In Singapore, there are only two healthcare REITs, Parkway Life REIT and First REIT. Though in the same industry, their fortunes cannot be more different from Parkway Life share price appreciating from S$2.30 to S$3.30 over a 5 years horizon while First REIT share price declined from S$1.45 to S$0.80 over the same period.
The underperformance seen in First REIT might be attributable to issues of its sponsor, Lippo Group.
#5 Hospitality REITs
Hospitality REITs hold properties in the hospitality sectors such as hotels and serviced apartments. The largest of them in Singapore is Ascott Residence Trust which has a market cap of S$2.8bn and properties all over the world such as Singapore, Australia, Indonesia, Japan, Germany, the UK, USA, etc.
Hospitality REITs tend to do well when the overall global economy is booming with a buoyant tourism industry. However, in a recession, Hospitality REITs will suffer.
No prices for guessing which is the REIT industry that has been among the most significantly impacted due to COVID-19.
#6 Data Centre REITs
Data Centre REITs own and manage facilities that house customers’ server racks which are used to store, process, and distribute data. These REITs are among the most highly sought after for their growth potential as well as defensiveness, even in a health pandemic which we are currently in.
Keppel DC REIT is the only listed data center REIT in Singapore and I would say it is the best performing REIT in Singapore YTD, but with one of the lowest yields at the moment.
#7 Diversified REITs
Diversified REITs own and manage a mix of property types and collect rent from tenants. For example, diversified REITs may own assets made up of both office and retail properties such as Suntec REIT and soon to be CapitaLand Integrated Commercial Trust.
Looking ahead, this will likely be the structure that most REITs will adopt, given increasing merger activities between REITs to increase their AUM and competitiveness against peers.
At present, Mapletree Commercial Trust is the largest and most popular diversified REIT with office and retail assets. They own large office buildings such as Mapletree Business City I and II as well as Singapore’s largest retail mall, VivoCity.
Section 1 Conclusion: This section provides a brief overview of the REITs in Singapore. While I am positive on its fundamentals, this is not a blanket statement to purchase all things REITs. It all voices down to portfolio positioning. If you are REITs heavy in the first place, then you should be looking to pare down some of the lower quality “high-yield” REITs that might not survive the current pandemic.
If you entered this health crisis underweight REITs, then you should be looking to purchase quality blue-chip REITs at a discount. I will be highlighting which are the REITs which I believe are worth considering in Section 4. For now, let’s evaluate the current REIT environment.
Section 2: Current REITs environment
Are REITs expensive in today’s environment?
I wrote an article entitled: Why I am still buying REITs even when they look expensive, back in Nov 2019, months before the pandemic began, with the core fundamentals of REITs still very much in-tact.
Then, Singapore REITs were trading with a forward yield of around 5.3% which is close to -2SD. Definitely “not cheap” on a yield basis. It was as high as 7.5% back in late-2011 and late-2015.
On a forward Price to book basis, it was trading at 1.15x, close to +2SD above its 8-years mean. Again not cheap.
Lastly, the yield spread (the difference between the FSTREI and Singapore government 10Y bond yield) was 3.5%, which is at -1SD. The average historical yield spread was 4.2%.
All the metrics were pointing to a certain level of over-valuation. However, my research then also indicated that buying REITs even when they look “over-valued” does not necessarily indicate it will be a bad investment based on their historical performance.
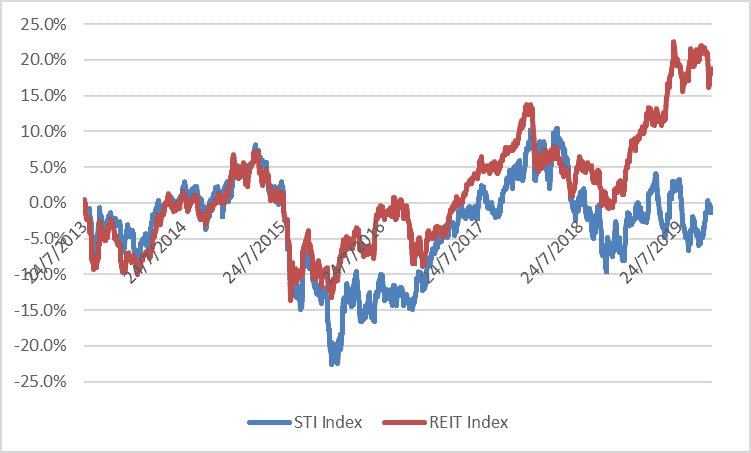
I assumed that I bought into the FSTREI when it was overvalued back in July 2013 and held on till end-2019. The result: Value of FSTREI appreciated by 18% during this period while the STI index is marginally negative.
This 18% appreciation over 6.5 years translates to about 2.8% in annualized capital appreciation. Add in the yield on cost of 4.2% and the total annualized returns become 7%. Not too bad. This is when you are buying REITs when they are EXPENSIVE.
So let’s have a quick look at REITs’ valuation now after the sell-off.
According to RHB Research, Singapore REITs are now yielding closer to 6.5%. This is one of the highest yield levels across the region, with only Australian’s REIT yield at a higher level of 6.7%.
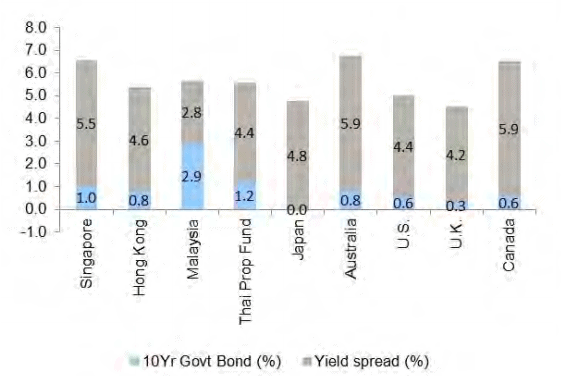
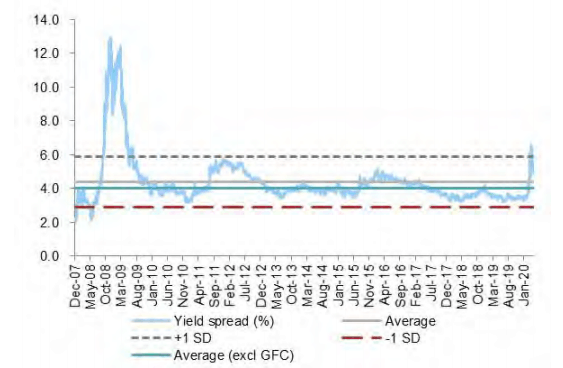
In terms of yield spread, it is now at 5.5%, which is above the average yield spread of 4.2% and coming close to the +1SD level of 6%. S-REITs did hit the 6% level back in March at the peak of the sell-off. Prices have since recovered.
On a price to book basis, Singapore REITs are now at about 1x PBR, which is the 8-years average level.
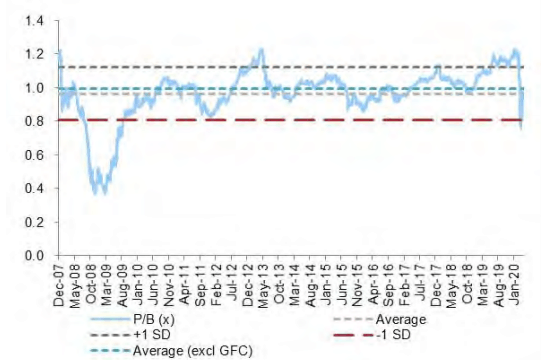
To summarise, they are no longer as expensive as compared to Nov-19 when I first evaluated the industry but still not at bargain prices seen during the GFC period.
So should one be invested in REITs now?
I cannot ignore the fact that COVID-19 has significantly disrupted the REIT industry. Many REIT industries are facing operational challenges that could have a lasting impact on their businesses in the medium-term.
Hospitality REITs are likely to see a prolonged drop in tourist arrivals impacting their hotel occupancy. High-end retail malls such as Paragon (owned by SPH REITs) are going to see a drop in retail purchases fuelled by rich tourists as well as a decline in medical tourism. Office REITs might see lower demand in the future as companies get more accustomed to the idea of employees working from home. While industrial REITs might be slightly more insulated, they are not immune with many SMEs potentially going belly-up.
The more resilient REITs are your Healthcare REITs and Data Centre REITs, which only encompass 3 out of the more than 40 REITs within the S-REIT universe.
So, yes, S-REITs near-term fundamentals have been negatively impacted and some of the weaker REITs might not survive. My suggestion is still to avoid chasing after high yield REITs which might prove transitional but instead look for bargain purchases on blue-chip REITs.
For those whose portfolio is REITs heavy, it pays caution to trim your exposure to REIT and possibly hold some cash to wait for a better entry point to reinvest your capital.
For those with existing REIT counters and a long investment horizon, it makes sense to remain vested in REITs as this investment class will continue to be a good source of passive income in a recession. However, re-evaluate your portfolio holdings and get out of counters which look attractive on a “yield basis” but with an extremely weak balance sheet.
For those who are thinking about getting your feet wet in terms of starting your REIT investing journey, this might be the time to get started, but do it strategically: ie, identify quality blue-chip REITs and spread out your entries.
Bottom-line: REITs continue to be a relevant investment class. This industry will not disappear because of COVID-19 (although some names might). At the current level, their yield spread indicates a certain level of undervaluation. Choosing the right REIT which can withstand the economic drawdown from a prolonged health pandemic will ultimately reap strong returns.
What happens if we head into a recession?
The R-word has been thrown around for some time and there is no doubt now that Singapore will see or is already in a recession in 2020.
The US government has already taken a dovish stance by driving short-term interest rates down to zero. However, fiscal stimulus engages by governments worldwide is not likely to be enough to offset the negative impact on businesses by the shutdown in the global economies.
That is where monetary stimulus or helicopter money comes in. How will that end up and will throwing money at consumers with the assumption that they will spend kick-start the economy? Too early to tell for now.
For now, the reality is that businesses will get impacted and tenants will start negotiating for lower rentals. Occupancy could drop significantly and that’s going to hit both the top and bottom-line performance of REITs.
The positive impact from lower interest rates might not be sufficient to stem an overall decline in earnings due to lower rentals and/or occupancy which will consequently lead to lower distributable income aka yield that a REIT dishes out.
We are already seeing that happening in our REITs.
In my previous article, I highlighted that “if a recession is to occur, REITs, like most asset classes will be negatively impacted. However, the drawdown will be partially negated by the lowering of interest rates. REITs with long WALE and floating loans will benefit from such a scenario”.
Unfortunately, the second part of the statement on floating loans might not be relevant, particularly if the credit rating of the REIT declines. High level of floating loans will only benefit the best of the blue-chip REITs which can refinance at lower interest rates because their credit standing hasn’t been affected.
For the smaller to medium-size REITs, having a high level of floating loans might be detrimental even in a lower interest rate environment as a cut in their credit profile due to the weakening of their business fundamentals could translate to even higher borrowing costs.
For example, Frasers Centrepoint Trust used to be able to issue fixed-rate notes at 2.6-2.8% before the downgrade in its credit rating. In its latest announcement on 30 April, the REIT highlighted that it is now issuing notes at a rate of 3.2%.
RHB has provided a good summary of the balance sheet and debt status of the REITs in Singapore as seen below.
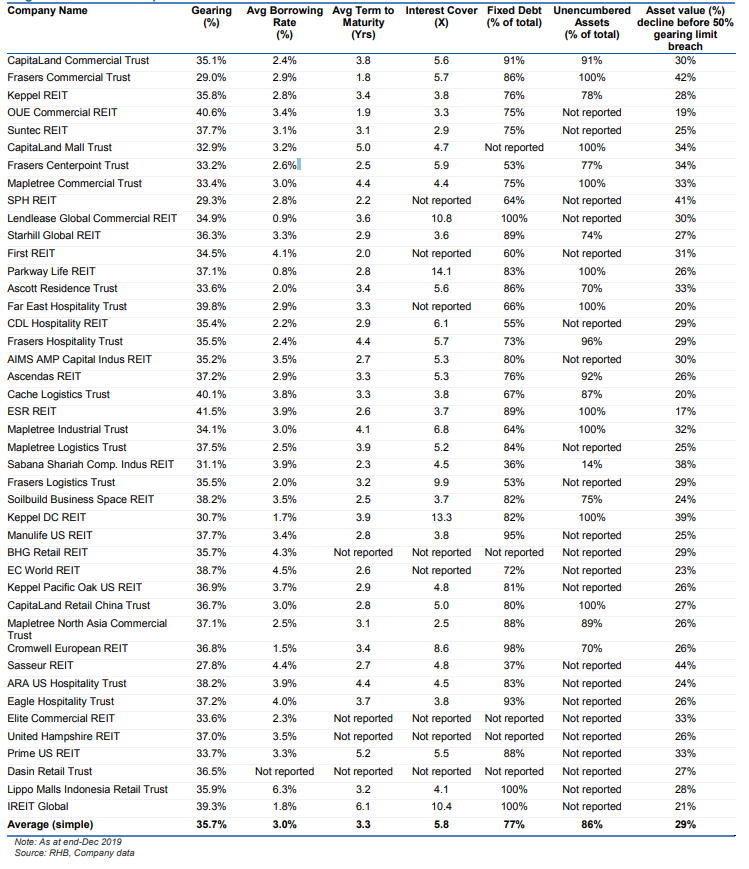
The brokerage house also provided a forecast as to the % of asset value decline before a REIT breaches its 50% gearing limit. The higher the ratio, the better it is. This has to be taken in conjunction with the operational outlook of the individual REIT itself.
Bottom-line: Blue-chip REITs with a good stable credit standing will benefit from a lower interest rate environment. In this case, having a high level of floating debt is ideal. They should also have unencumbered assets (such as CapitaLand Mall Trust at 100%) which increases their financial flexibility. These are the ones that will most likely survive a recession and an investor should look to capitalize on share price weakness on sell-downs.
New measures to help REITs navigate the current challenging environment
When news broke on 1 April that the Singapore government is introducing a temporary bill to suspend enforcement actions by commercial landlords against tenants who are unable to pay their rent as a result of COVID-19 for up to 6 months (potentially extending to 12 months), there were widespread concerns that such a bill will be extremely detrimental to the REITs as they might not be able to collect rentals from most of their tenants for up to 6 months and there could be many cases of defaults at the end of the six months. REITs in the meantime, still need to serve their interest obligations.
REITAS on 6 April pen a note to the government to register their concerns on such enforcements that could jeopardize the long-term health of the S-REIT industry and Singapore’s attractiveness as a REIT listing venue.
Law and Home Affair Minister K. Shanmugam look to address that concern, publish in this straits times article that the government is not anti-landlord but highlighted that every player in the economic chain would have to bear a portion of the pain incurred by COVID-19.
So far it seems that not many tenants are “taking advantage” of this new bill and requesting for deferment of their rentals, according to Frasers Centrepoint Trust, in their half–year result webcast briefing. According to management, they are currently only 1 deferment request and they expect only up to 10-15% of its tenants requesting such deferment in a worst-case scenario.
In the meantime, the government is also doing its part to help alleviate the financial constraints of the REITs. On 16 April, MAS released a set of new measures to help REITs navigate the challenges posed by COVID-19.
Key points are:
1.Extension of the permissible period for distribution of taxable income
MOF and IRAS will extend the timeline for S-REITs to distribute at least 90% of their taxable income from 3 months to 12 months (after the end of Financial Year (FY) 2020) to qualify for tax transparency [1]. This extension is only applicable for distributions made from taxable income that is derived by an S-REIT during FY2020. For example, to avail of the tax transparency treatment for FY2020 taxable income, S-REITs with FY2020 ending 31 March 2020 and 31 December 2020 will have up to 31 March 2021 and 31 December 2021 respectively, to distribute to their unitholders at least 90% of their taxable income derived in FY2020.
The extension will give S-REITs more flexibility to manage their cash flows. As S-REITs typically distribute the bulk of their income to unitholders, they tend to hold lower cash reserves.
2. Higher leverage limit and deferral if interest coverage requirement
MAS will raise with immediate effect the leverage limit for S-REITs from 45% to 50%, to provide S-REITs greater flexibility to manage their capital structure amid the challenging environment created by the COVID-19 pandemic.
MAS will defer to 1 January 2022 the implementation of a new minimum interest coverage ratio (ICR) requirement. In its public consultation last year [2], MAS had proposed to require S-REITs to have a minimum ICR of 2.5 times before they are allowed to increase their leverage to beyond the prevailing 45% limit (up to 50%). The implementation of the ICR requirement will now be deferred as S-REITs’ ICRs are likely to come under pressure in the near term due to the negative impact of the COVID-19 pandemic on their earnings and cash-flows.
The higher leverage limit, together with the enhanced share issue limit announced by SGX RegCo, will allow S-REITs to have continued access to different funding channels, including borrowing from banks, issuing bonds, and raising equity.
Bottom-line: REITs are not expected to bear the full-brunt of Singapore’s economy lockdown. While most REITs operational outlook will be negatively impacted, resulting in a reduction in their DPU for 2020 at least, the decline in DPU trend this year is not expected to be a permanent feature and the expectations by the street are that DPU growth will resume strongly in 2021.
The new measures implemented will provide REITs with some breathing space in terms of their financials and the imminent “need for capital raising” as some naysayers have forecasted.
I have highlighted previously that REITs are coming into this recession with a much stronger balance sheet as compared to during the GFC. There were widespread uncertainties then about the banking industry, with banks unwilling to refinance companies with a weak balance sheet. REITs, in turn, have to seek new capital through equity-raising which further pressured their share prices.
Coming into this recession, our local banks are in a much stronger financial footing to support companies in terms of their refinancing needs, albeit potentially at a higher interest cost. Blue-chip REITs with a strong balance sheet will not face the issue of refinancing risk in this recession.
Outlook of KEY REIT industries
Industrial REITs
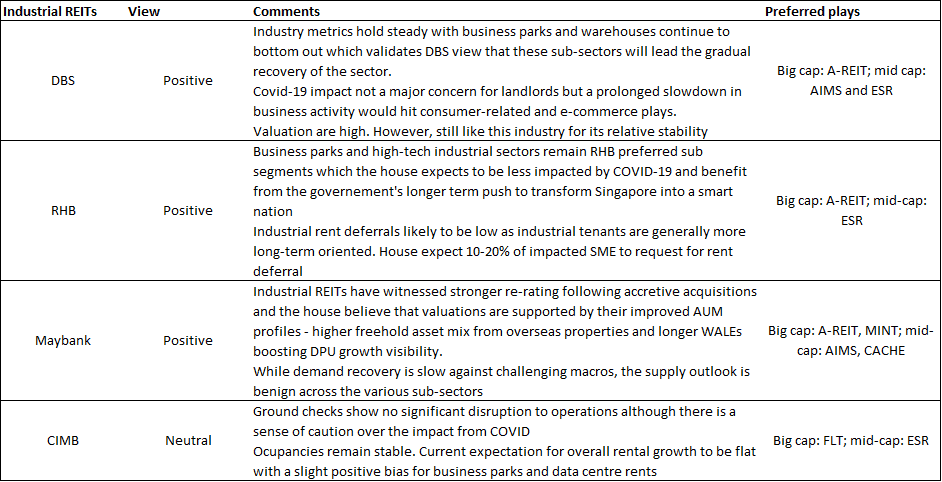
We look to collate the views of some of the brokerage houses in Singapore such as DBS, RHB, Maybank, and CIMB. The general sense is that the industrial REITs are a more resilient bunch amid the current health pandemic where operations are not likely to be as significantly impacted.
However, the demand outlook for industrial REITs remains relatively benign except for a few subsectors such as business parks and high-tech industrial space.
Favorites among the big cap names are Ascendas REIT while among the mid-cap names, ESR-REIT shines as the preferred play.
Retail REITs
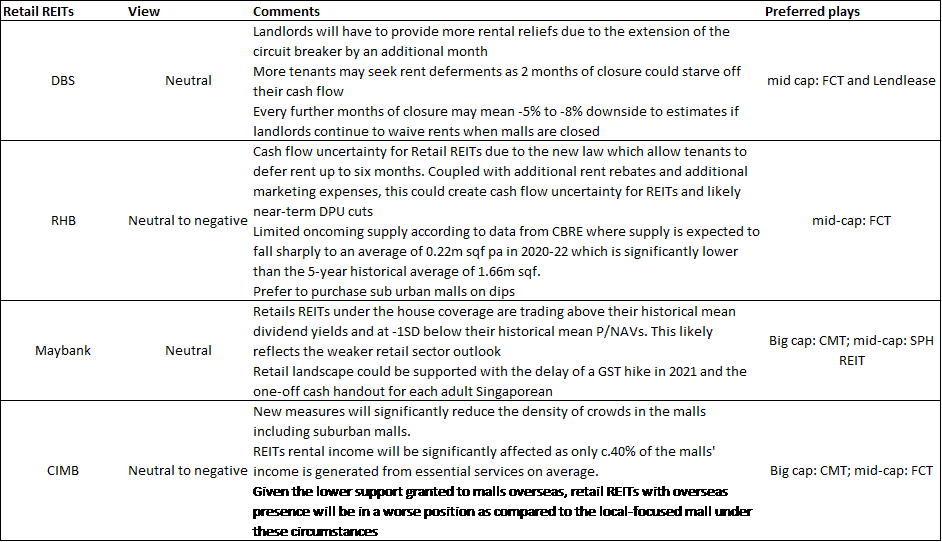
The outlook for retail REITs are not as positive as that of its industrial REITs counterparts due to “circuit breaker” negatively impacting retail malls operations. Most of the houses have a neutral to negative outlook for this industry and prefer selective exposure.
Large caps preferred play is CMT due to its impending merger with CapitaLand Commercial Trust where the houses believe the stability of the REIT will increase and put it in a stronger position for acquisitions.
Mid-cap preferred play is FCT due to its suburban exposure.
Interestingly, Maybank has SPH REIT as one of its top mid-cap retail buys because of valuation. According to the house, SPH is attractively valued as its current price implies a P/B level that is even lower than the historical trough level.
Hospitality REITs
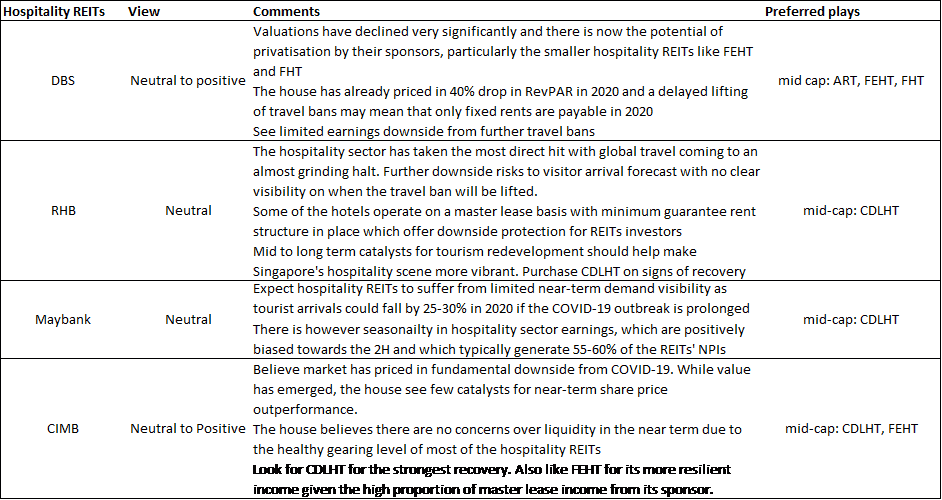
The expectations for hospitality REITs are pretty low in the short-term, understandably so due to the breakdown of the tourism industry in Singapore.
However, valuations are now at rock bottom and further hence further downsides might be limited.
According to DBS, there might be potential for privatisation by sponsors for FEHT and FHT
While there is no clear consensus, CDLHT seems to be the preferred play for a recovery in this industry.
Office REITs
The consensus seems to point to a manageable short-term impact from COVID-19 with rentals not being significantly affected. However, the medium to long-term trend might not be so favorable as companies downsize or more employees working from home “option” becomes increasingly adopted, resulting in the need for less office space
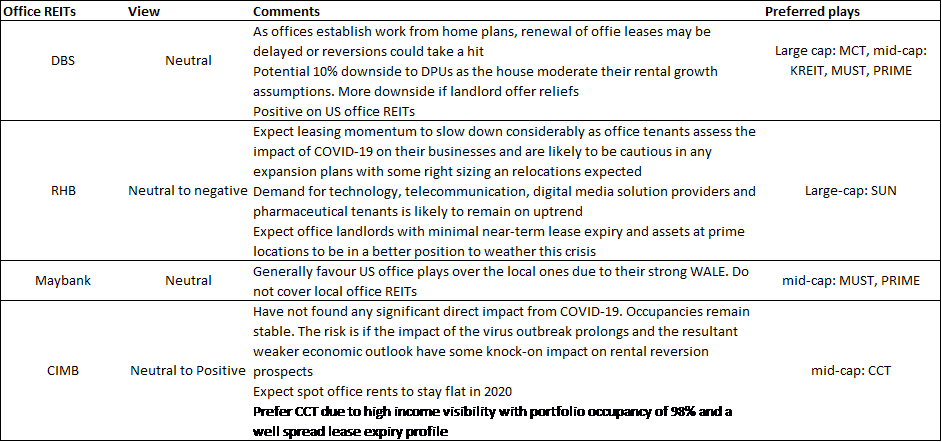
Section 2 conclusion: REITs are no longer as “expensive” in terms of valuation metrics such as P/ book and yield spread as compared to end-2019. However, the short-term fundamentals of most S-REITs have been impacted and this factor should be taken into account when evaluating the attractiveness of REITs at their current pricing level.
When compared to the GFC period, share prices of REITs have not declined significantly in this crisis even at the worst point in March 2020. However, S-REITs are in a much stronger position coming into this crisis where their balance sheets are not significantly geared. Banks are in a strong position to refinance REITs and the government has stepped in with new measures to help REITs and tenants in this difficult time.
Hence, we see refinancing risk as relatively low for blue-chip REITs, with some likely benefitting from lower refinanced costs due to their strong credit rating profile and strong business fundamentals.
In terms of individual sector outlook, Industrials + Healthcare + Data Centre looks to be the best positioned to ride out the crisis unscathed while Retail and Hospitality could ultimately see some casualties. The outlook for Office REITs is generally more neutral in the short-term but the change in the way companies operate (more work from home policies etc) could pressure the medium to long-term outlook of office rentals.
We will talk more about individual REIT selection in Section 4.
Section 3: How to buy REITs in Singapore
There are several ways to buy REITs in Singapore. One can look to purchase individual REIT counters themselves on a DIY basis through your own brokerage house (DBS Vickers, UOB Kay Hian, etc). Alternatively, one can also buy a basket of REITs through an ETF such as the Lion-Phillip S-REIT ETF using an RSP method or a lump sum method. Last but not least, REITs can also be invested through a Robo Advisor such as Syfe which provides an investor with the option to invest in a pure 100% REIT portfolio.
Let me first touch on the key financial metrics that one should be on the lookout for when selecting individual REITs on a DIY basis. I will then describe purchasing REIT ETFs as well as REIT investment through a Robo advisor such as Syfe.
10 Quantitative screening filters
I came out with 10 quantitative financial metrics that serve as a screening filter which I detailed in this article: How to buy REITs in Singapore. 10-key S-REIT Quantitative filter (Part 1)
This provides me with a quick and easy solution to filter and identify REITs in Singapore which might be undervalued, based on business fundamentals and “price attractiveness”.
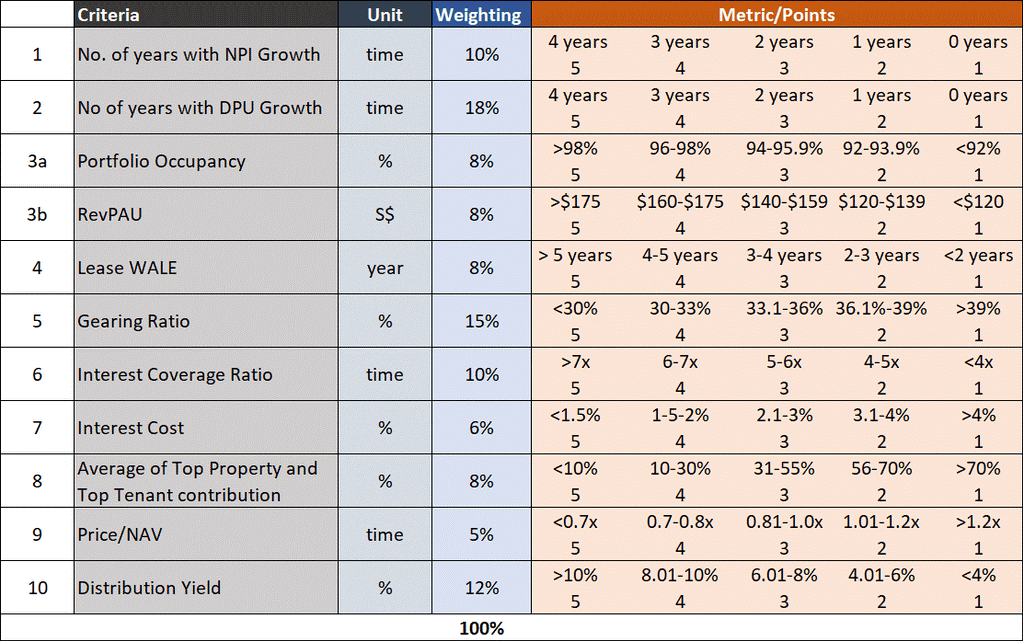
For each of the 10 metrics, I associate a weighting to it. For example, I view a steady DPU growth trend as more important vs. its current Price/NAV. Hence for the former, I tag a weighting of 18% compared to the latter with a 5% weighting.
Each metric is then given a scoring system of 1-5 points. For example, if a REIT has 4 years of YoY DPU growth, it will be awarded 5 points. If there is zero YoY DPU growth recorded, it will be awarded 1 point.
The points are then weighted across their respective criteria weighting and the points summated to get its final score. The max score is 5 and any REITs with a score above 3.5 will be under-consideration.
Note that these 10-key metrics on evaluating which REITs in Singapore are attractive to buy is just the first step in the purchase decision. The next step will then be to evaluate more subjective areas such as management remuneration profile, acquisition growth pipeline, etc, rental revision trend, etc. This will be covered in Part 2 of our article.
Let me now briefly go through each criterion.
How to buy REITs in Singapore. The 10 key focal points. (Information accurate as of mid March 2020)
METRIC # 1: NO OF YEARS WITH NPI GROWTH
A REIT Net Property Income or NPI for short, is essentially its gross revenue minus property maintenance fees, property taxes, and other operating expenses that are related directly to the property.
It is a key barometer to evaluate how well a REIT’s portfolio of properties is performing as well as the rise/fall in their associated costs.
Using this metric, one can have a quick overview of how the REIT can grow its revenue, be it from higher rentals or acquisitions. A steady rising NPI growth every year illustrates the REIT’s ability to grow revenue by rental hikes which is a good sign.
Using Ascendas REIT as an example, the REIT has demonstrated 4 years of YoY NPI growth as seen from the table below. As such, it will be given 5 points for this metric.

For this metric, we associate a 10% weighting.
METRIC # 2: NO. OF YEARS WITH DPU GROWTH
A REIT distribution per unit or DPU for short is what it pays out as dividends to unitholders. Consistent DPU growth should be one of the most important criteria when evaluating a REIT, in my opinion.
Theoretically, a REIT that shows a consistent NPI growth should also be demonstrating the same positive growth trend in its DPU. However, that might not be the case due to changes in finance cost, etc.
A REIT’s ability to manage its finance cost, the REIT manager’s remuneration payment, and other non- property expenses well will determine if it can translate NPI growth into DPU growth.
We have written about the track record of S-REITs dividend growth in this article: Which S-REITs have the Best record of dividend growth.

For Ascendas REIT, the REIT has been able to translate its 4-years consecutive NPI growth into DPU growth as shown in the table below, hence it gets 5 points.
For this metric, we associate an 18% weighting.
METRIC # 3: PORTFOLIO OCCUPANCY/REVENUE PER AVAILABLE ROOM
A REIT’s property portfolio occupancy illustrates the attractiveness of its property. A property with a close to 100% occupancy rate is likely highly sought after and will be able to command a rental premium or a positive rental revision in the next lease cycle.
A property with a low occupancy rate might be finding it a challenge to lease out its property units which might translate to a rental discount.
However, in a rising rental market environment, property at 100% occupancy rate with a long WALE (where leases are locked in) might be viewed as a disadvantage due to its inability to raise rental during this period.
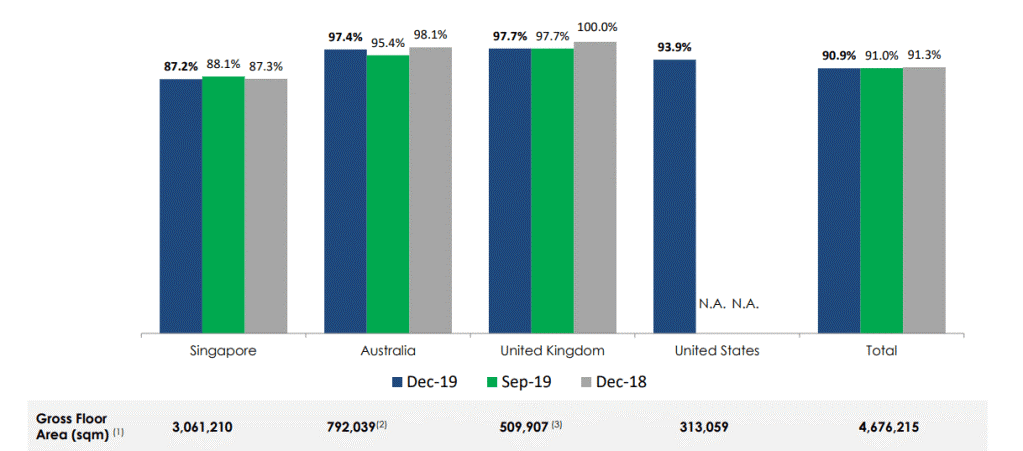
For Ascendas REIT, the overall Group’s Portfolio Occupancy rate is rather weak at 90.9% as of 31 Dec 2019. Hence for that, it only gets 1 point. However, it might be unfair to penalize Ascendas REIT based on a low portfolio occupancy rate, particularly if it is associated with a strong rental reversion trend. We will touch on rental reversion in Part 2 of our article.
For this metric, we associate an 8% weighting. For the hospitality REITs, portfolio occupancy is replaced by Revenue per Available Room (RevPAR) as the evaluation criterion, with the same 8% weighting.
METRIC # 4: PORTFOLIO WEIGHTED AVERAGE LEASE EXPIRY
A REIT’s Portfolio Weighted Average Lease Expiry or WALE for short, as the name implies, illustrates how long its portfolio of properties is being leased out for.
A long WALE will give investors’ assurance of revenue stability whereas a short WALE might present concerns over rental renewal.
For Singapore properties, properties’ WALEs are typically much shorter than those properties based in the US, AUS, UK, or Europe. Long WALEs typically do have a rental escalation clause built in the contract to ensure a certain level of revenue growth visibility.
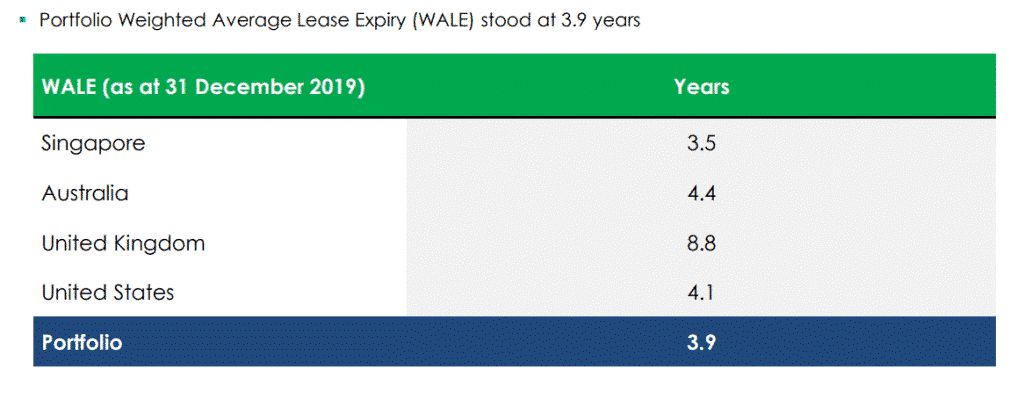
For Ascendas, its portfolio WALE stood at 3.9 years as of 31 December 2019. It gets 3 points for metric.
For this metric, we associate an 8% weighting.
METRIC # 5: GEARING RATIO
A REIT’s gearing ratio, defined as its total borrowings divide by total assets, is one of the most important metrics when evaluating a REIT.
Currently, the Monetary Authority of Singapore (MAS) has a 45% leverage ceiling for all S-REITs. This was likely taken post-GFC when REITs then were more significantly leveraged and faced credit concerns when the global banking system froze up. As banks do not wish to refinance (partially due to concerns over REITs leveraged balance sheet), S-REITs found themselves in a situation where they had to turn to the capital market in the form of rights issuance just when their prices were heavily sold off.
Today, most REITs gearing ratios are significantly lower vs. GFC period. For Ascendas, its latest gearing ratio is 35.1% which earns it 3 points in this category.

For this metric, we associate a 15% weighting.
METRIC # 6: INTEREST COVERAGE RATIO
A REIT’s interest coverage ratio measures the number of times its EBITDA can cover its interest expense.
An interest coverage ratio of 3x is often considered a benchmark for being able to cover fixed charges.
This metric is somewhat related to the gearing ratio. A high-interest coverage ratio might be able to help compensate for the “relatively” higher gearing ratio, something which the lender will likely take into consideration when evaluating the credit risk profile of the REIT.
A REIT might illustrate a lower-than-average gearing profile. However, if its operations are not generating sufficient operating profits (based on EBITDA), it will have a low-interest coverage ratio which is a key cause for concern.
For Ascendas REIT, it has an interest coverage ratio of 5.4x which is considered average. It gets 3 points for this metric.
For this metric, we associate a 10% weighting.
METRIC # 7: INTEREST COST
A REIT’s interest cost will demonstrate its ability to secure cheap funding. This ties back to the resilient-nature of its business. For example, a REIT like Keppel DC REIT has one of the lowest interest costs in the industry at 1.9% compared to all the other S-REITs with key operations based in Singapore.
Typically, REITs with assets based overseas can secure a much cheaper cost of debt as compared to those with Singapore-based assets. However, REITs currently already enjoying a low cost of debt might not be able to benefit further from a lower-trending interest cost environment.
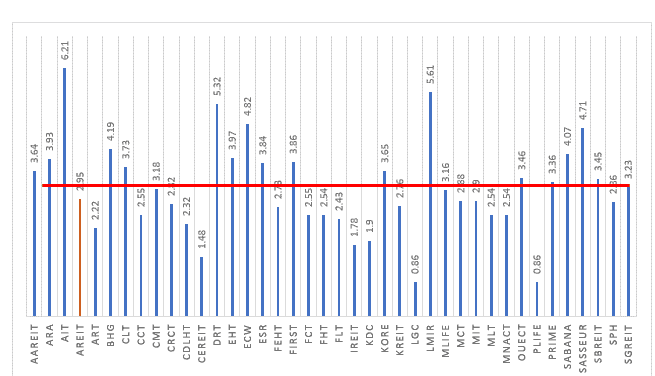
Ascendas REIT cost of debt currently stands at 2.95% which is slightly lower than the sector average of 3.2%. For that, it gets 3 points.
For this metric, we associate a 6% weighting
METRIC # 8: AVERAGE OF TOP PROPERTY AND TOP TENANT CONTRIBUTION
We look to avoid concentration risk relating to an individual property as well as to tenants. A prime example would be the negative impact that Festival Walk had on Mapletree North Asia Commercial Trust when this key property was damaged during the HK protest period. Festival Walk accounted for 64% of Mapletree North Asia Commercial Trust’s revenue, hence any disruption to this one asset will have a huge impact on the REIT’s overall operational performance.
The same can be said for the key tenant which encompasses a huge proportion of a REIT’s revenue. This presents significant concentration risk and their departure might cause a substantial problem in finding new lessees to fill up the gap.
Ascendas REIT scores very well in terms of diversification, with its average percentage for this metric at a low 4.9%. It gets a score of 5.
For this metric, we associate an 8% weighting
METRIC # 9: PRICE TO NAV
This metric takes into consideration a REIT’s valuation, particularly it’s market capitalization over its net asset base.
Given that REITs are all asset-heavy, there is little argument here about how an asset-light company might seem hugely over-valued based on its price-to-book ratio.
While a multiple above 1x might indicate a certain level of over-valuation, it might not necessarily mean that the REIT makes for a poor investment.
We notice that most of the bigger blue-chip companies are trading more than 1x book while smaller-cap REITs are trading at a discount to their book.
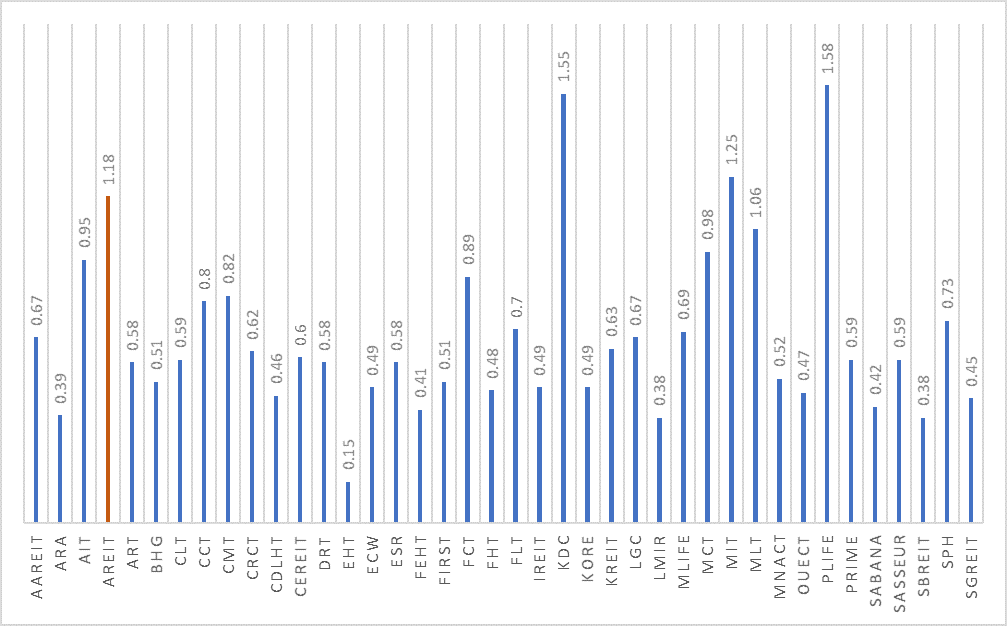
For Ascendas, following the past two weeks of sell-down, the counter is now trading at 1.11x P/NAV, still one of the highest in the industry. The S-REIT Industry now has an average Price/NAV of 0.67x, one of the lowest I have seen in years. It gets a score of 2 for this metric.
For this metric, we associate a 5% weighting
METRIC # 10: DISTRIBUTION YIELD
A REIT’s distribution yield is one of the key focal points when it comes to assessing the attractiveness of a REIT as an income-generating asset.
Most of the time, we like a high distribution yield REIT counter vs. a lower one but that has to be evaluated alongside the sustainability of such dividend payments to assess if the REIT is indeed attractive.
For example, the distribution yield of Eagle Hospitality Trust is now at a mind-boggling 43%. That could be due to the significant share price correction of Eagle Hospitality Trust in recent days. However, one will need to evaluate the feasibility of the trust to continue the same DPU payment. Given the lack of DPU track record, it is difficult to be assured that Eagles Hospitality Trust DPU amount can be maintained (and hence achieve the distribution yield of 43% based on current price).
On the other hand, Ascendas REIT has demonstrated that its DPU payment has been extremely stable, with consecutive DPU growth over the past 5 years (Metric 2).
Hence, we are more assured that Ascendas DPU can be maintained (even if there might not be growth) vs. Eagle hospitality Trust.
Ascendas REIT distribution yield now stands at 6.5%. For that, it gets a score of 3 points.
For this metric, we associate a 12% weighting.
THE OVERALL SCORE FOR ASCENDAS REIT BASED ON OUR SCORING SYSTEM
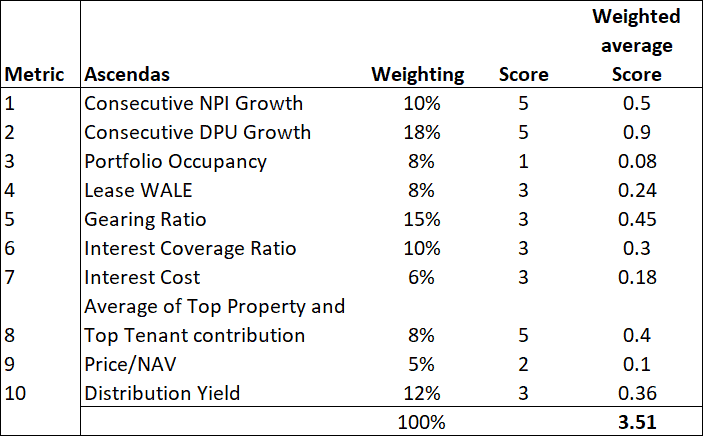
Ascendas REIT has a total weighted average score of 3.51, which narrowly qualifies for our consideration list in this example.
Once a REIT passes the screening criteria, I will move on to Part 2 which is to evaluate the REITs on qualitative factors.
8 additional Qualitative factors to consider
In Part 2, we look at 8 less quantitative factors. These are:
1. Benefits of a strong sponsor
2. Sustainability of DPU growth/DPU support
3. REIT managers remuneration scheme
4. Rental reversion trend
5. Frequency of equity raising vs. asset recycling
6. Access to cash and line of credit facilities/unencumbered properties
7. Tenants profile
8. Specific industry outlook
Let’s look at them one by one.
KEY FACTOR # 1: BENEFITS OF A STRONG SPONSOR
A strong REIT sponsor is often under-rated but it should be part of the evaluation process when looking at purchasing REITs. REITs that are backed by strong sponsors/parents who are property developers with excellent credit ratings are often seen as more attractive vs. those whose sponsors are facing credit-related risks.
For example, Mapletree-Group of REITs has likely benefitted from Mapletree’s excellent credit rating. Other REITs that have strong sponsors include Keppel-Group of REITs and CapitaLand-Group of REITs.
On the other hand, the First REIT saga illustrates that a sponsor with a weak reputation can hurt the REIT itself. First REIT’s share price collapsed back in late 2018 when its main revenue contributor (concentration risk) and sponsor, Lippo Karawaci saw its credit ratings being downgraded by Fitch from B to CCC+ over concerns about its liquidity risks as well as alleged bribery linked to one of the Lippo Group’s asset.
Hence, despite First REIT ranking relatively well in our quantitative factor scoring with a score of 3.8 at present, I will likely give it a miss after taking into consideration its sponsor factor, despite also operating in a relatively recession-proof healthcare sector.
A strong sponsor will also encompass a strong pipeline of assets for future growth. A strong sponsor can give REIT access to valuable assets through a robust pipeline of quality asset injections. REITs are not obligated to purchase these assets from their sponsors but will usually have first rights of refusal. This serves as a ready source of inorganic growth for the REIT.
Last but not least, a strong sponsor, such as a reputed property developer, will provide a certain level of corporate governance assurance and financial backing for the REIT in the event of a crisis.
KEY FACTOR # 2: SUSTAINABILITY OF DPU GROWTH/DPU SUPPORT
We talked about DPU growth as one of our quantitative metrics, one of which we placed significant importance on. We quantify it by looking at the number of years a REIT has demonstrated DPU growth on a YoY basis.
Given its importance, it is also important to evaluate how might DPU growth/decline materialize in the future. This can be through a few manners:
Yield accretive inorganic acquisition. This means that despite the higher share base (due to rights issuance), the overall yield on a DPU basis can still grow if yield accretive assets were being acquired.
Positive Asset Enhancement Initiatives. REITs will engage in asset enhancement initiatives or AEI for short on their properties from time to time. These AEIs, if done well, will translate to an ability to charge higher rental rates to tenants. Look out for properties that might be currently doing major AEI works on their key properties. This might hurt DPU in the short-term but could result in DPU growth upside in the medium and long-term.
Reduction in interest costs: Given that REITs are highly levered assets, a reduction in interest costs on borrowings will have a relatively significant positive impact on their profitability and consequently distributable income.
Increase in Managers’ fees payable in units: For REITs who are not fully paying their management fees in units, they can have the flexibility to increase management fees in units to reduce outright cash cost. For example, Capitaland Commercial Trust’s management fees are fully paid in cash instead of units. If the business sees a dip in today’s context, the REIT can choose to partially or fully convert to unit payments. This will conserve cash and ensure that the REIT can continue to grow its DPU.
Loss of DPU Support: One often overlooked area is DPU support from the sponsor or significant shareholder. In the first few years of listing, the strategic investors might not be eligible to take dividend distributions (this information can be found in the prospectus). This increases the overall pool of distributable income to minority shareholders. However, once that lock-up period has lapsed, one will realize that there will be a sudden and huge decline in distributable income to minority unitholders.
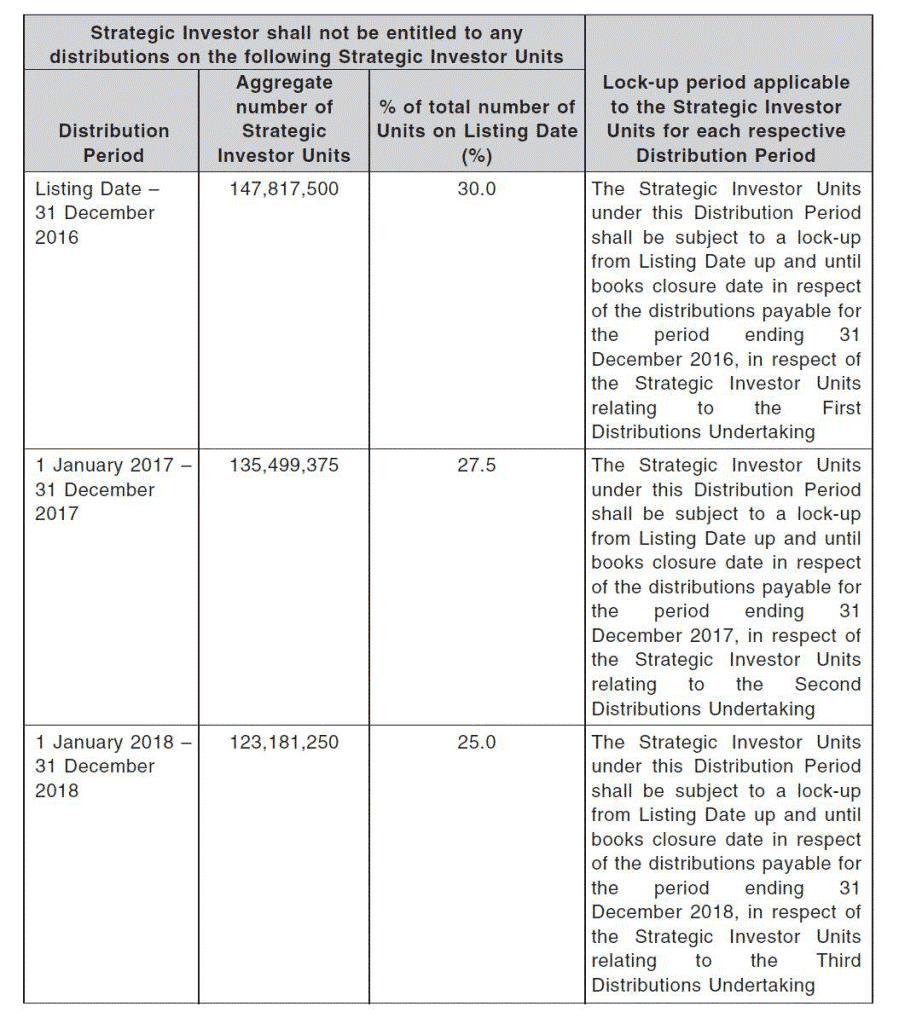
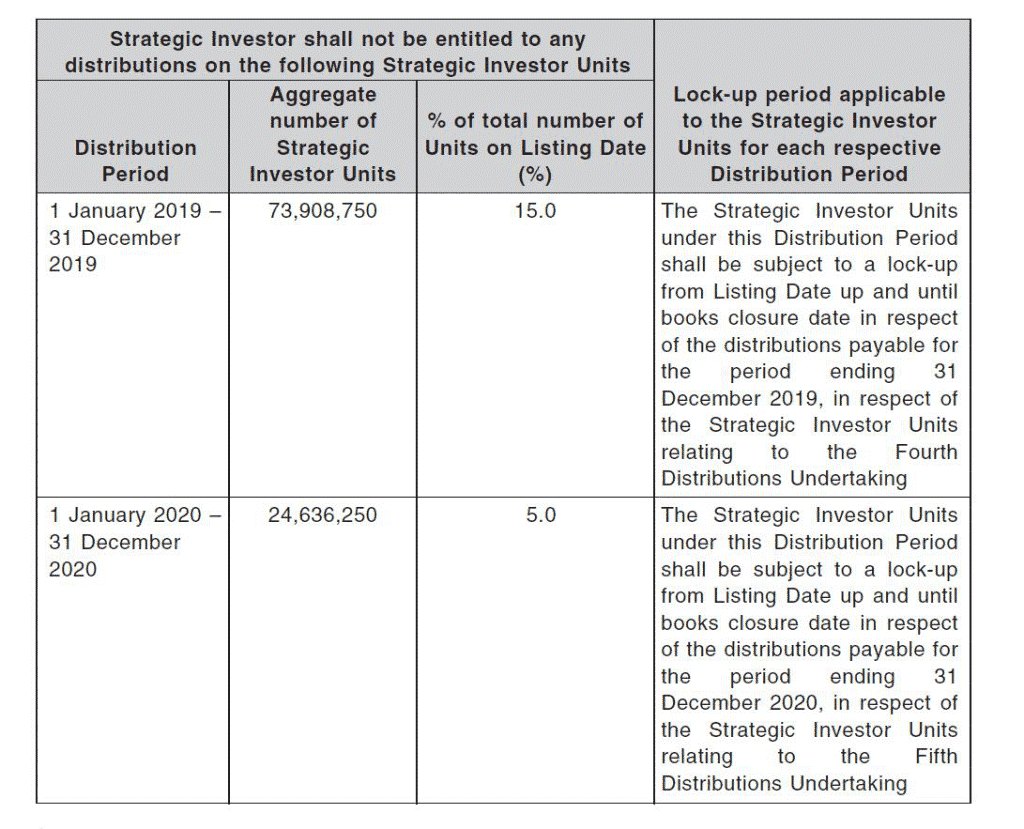
BHG Retail REIT is such an example. In the first year of its listing, 30% of unitholders (strategic investors) are not entitled to any distributions. By the 5th year, this ratio declines to 5%.
KEY FACTOR # 3: REIT MANAGERS REMUNERATION SCHEME
We will want to see that a REIT manager’s remuneration is aligned with that of unitholders. As a unitholder, we will want to see that the REIT manager is fairly compensated and NOT overly compensated.
If DPU has been growing consistently, it is fair that a REIT manager’s fees grow at a rate following that of DPU growth. If management fees are growing at a rate excessively more than the rate of DPU growth, then we might have a problem of “over-compensation”.
This can happen because performance fees for REITs can be calculated based on Gross Revenue and NPI growth. Recall we highlight that NPI of a REIT can be growing but that does not necessarily translate to a corresponding DPU growth due to a variety of factors such as management fees and finance cost etc.
Hence, in a situation where the performance fee of a REIT is not pegged to DPU growth but instead to gross revenue or NPI, then there might be a conflict of interest.
I have written in this article: Are you overpaying your REIT manager? Which S-REITs have the “highest” management fees, detailing the components of a REIT manager fee (1. Base fee and 2. Performance fee) as well as the payment structure of S-REIT managers.
Most of the REITs have a manager payment schedule where asset management fees as a percentage of distributable income from operations (based on 2019) fall within the 10-15% band. There are some outliers which we might want to avoid if fees start crossing significantly beyond the 15% ratio.
Those that pay management fees in cash (100%), counters such as CapitaLand Commercial Trust, Keppel DC REIT, Parkway Life REIT, CapitaLand Mall Trust, etc have the flexibility to convert management fees payment partially/fully to units to maintain their DPU growth trend.
To summarize, we can and should track a REIT’s DPU growth trend relative to manager fees growth trend to see if a REIT manager’s interest is aligned with that of unitholders.
KEY FACTOR # 4: RENTAL REVERSION TREND
The rental reversion trend is one of the key metrics that most will analyze when forecasting revenue growth.
However, the problem is that rent reversion is not standardized across the industry. A +5% rental reversion by Keppel REIT, for example, is different from a +5% rental reversion by Frasers Commercial Trust.
The BusinessTimes, back in early 2017, highlighted this issue in an article: REITs must be consistent in how they compute rental reversions.
The article highlighted the varying methods in which REITs used when disclosing their rental reversion percentage.
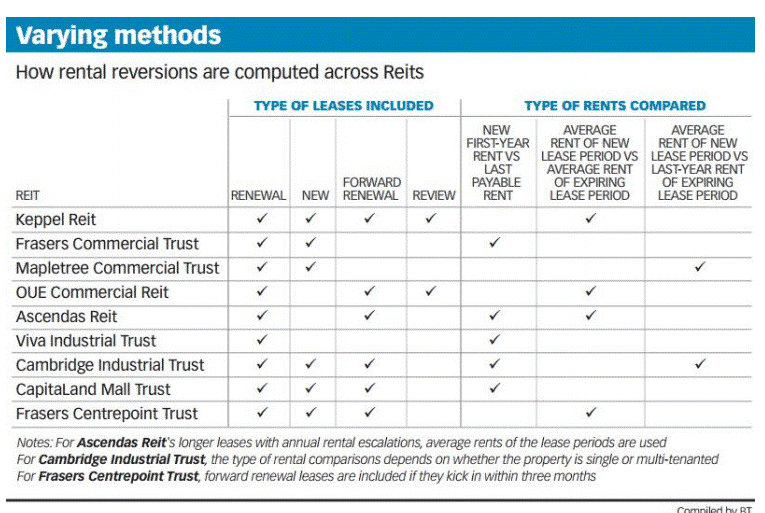
For Keppel REIT, the way it calculates rent reversion, based on average rent of new lease period vs average rent of expiring lease period, might be a LESS conservative method compared to Mapletree Commercial Trust which uses the average rent of new lease period vs. LAST YEAR rent of expiring lease period, in a rising rent environment.
The most conservative manner I feel is when you compare the new first-year rent vs. last payable rent. This method is adopted by Frasers Commercial Trust for example. You can immediately see how the actual cash flow will be impacted. Using the average rental of the new lease period will essentially “overstate” the income statement relative to cash flow as the “higher” average rental is not yet realized as cash flow.
Take for example a 3-years lease with the lease amount of $10 in the first year, $10.50 in the second year, and S$11 in the third year. The previous 3-years lease was at $8.50, $9.00, and $9.50 per annum respectively.
Using the method of new first-year rent vs. last payable rent, the rental reversion would be ($10-$9.50)/$9.50 = 5.3%
The second method of comparing average rent of new period and an average rent of the old period, the rental reversion would be ($10.50-$$9.00)/$9.00 = 16.7%
The third method of comparing average rent of new period vs. last payable rent, the rental reversion would be ($10.50-$9.50)/$9.50 = 10.5%.
Same rental increment amount but seemingly different rental reversion conclusion.
A portfolio where a 5% rental reversion occurs might not translate to a 5% increase in gross revenue on a YoY basis. That figure might be way lower in some cases. Hence it will be useful to dig a little deeper into the rental reversion methodology of your REITs.
Rental reversion should be taken in context with the portfolio occupancy rate. A strong rental reversion trend can be an offsetting factor for a low occupancy rate. Similarly, a weak rental reversion trend can negatively offset the high occupancy rate.
Ascendas REIT, which has a relatively low occupancy rate for its Singapore properties, exhibit strong rental reversion trends (although they use Method 2 in the computation). The strong rental reversion trend can be taken into consideration to help offset its low SG property occupancy rate. Ascendas REIT can well-afford to lower its rental asking price to “fill-up” its properties to a higher occupancy level if it so wishes to.
KEY FACTOR # 5: FREQUENCY OF EQUITY RAISING VS. ASSET RECYCLING
Given that S-REITs are mandated to payout 90% of their taxable income each year in the form of distributions, most REITs do not have spare capital to deploy when it comes to making new acquisitions. Hence they tend to turn to the capital market in the form of equity raising (rights) to raise new capital for new asset acquisitions. This will result in a higher outstanding share base and if distribution income did not increase correspondingly, that will result in an overall decline in DPU.
I tend to favor REITs that can grow their income organically through AEIs, cost-management, etc vs. one that constantly turns to the capital market for equity to grow through inorganic means. Given that the base fee of a REIT manager’s compensation schedule is tied to its asset base, there is an incentive on the part of the REIT manager to acquire new properties, sometimes at the detriment of unitholders.
On the other hand, there is less incentive for a REIT manager to divest their assets as such an action will reduce the overall asset under management (and their recurring base fee). A good REIT manager will look at constantly recycling their portfolio of assets, divesting assets with lower-than-average capitalization rates vs. similar properties while concurrently using the proceeds to acquire yield-accretive assets. In this manner, the REIT does not need to turn to the capital market to raise funds.
For example, Keppel REIT, in late 2019, divested Bugis Junction Towers for S$547.5m, realizing capital gains of S$378.1m, with the proceeds providing the company with the financial flexibility to engage in the buyback, acquisitions, debt reduction and distributions to unitholders.
Unfortunately, the company did not fare well in our quantitative screening process, with a score of only 3.04. This is due to inconsistency in its NPI as well as DPU. We also note that Keppel REIT has an extremely high management fee ratio of 25%. Seems like the REIT manager is “overpaying” themselves.
KEY FACTOR # 6: ACCESS TO CASH AND LINE OF CREDIT FACILITIES/UNENCUMBERED PROPERTIES
While a REIT’s gearing profile gives us a quick overview of its leverage situation, it is always useful to note the REIT’s outstanding access to cash and line of credit facilities provided by its bankers.
A REIT with a “decent” level of gearing, say 35% might be at a high risk of running into funding issues in today’s context if they have got ZERO access to an additional line of credit facilities. Ascendas REIT (gearing of 35.1%) for example has got approx. $1.2bn outstanding credit facilities available for it to drawdown. This is roughly 25% of its current total debt.
If insufficient, Ascendas REIT unencumbered properties as a percentage of total investment properties is at a high 91.8%. This provides it with the added financial flexibility to tap on secured borrowings, if required, ahead.
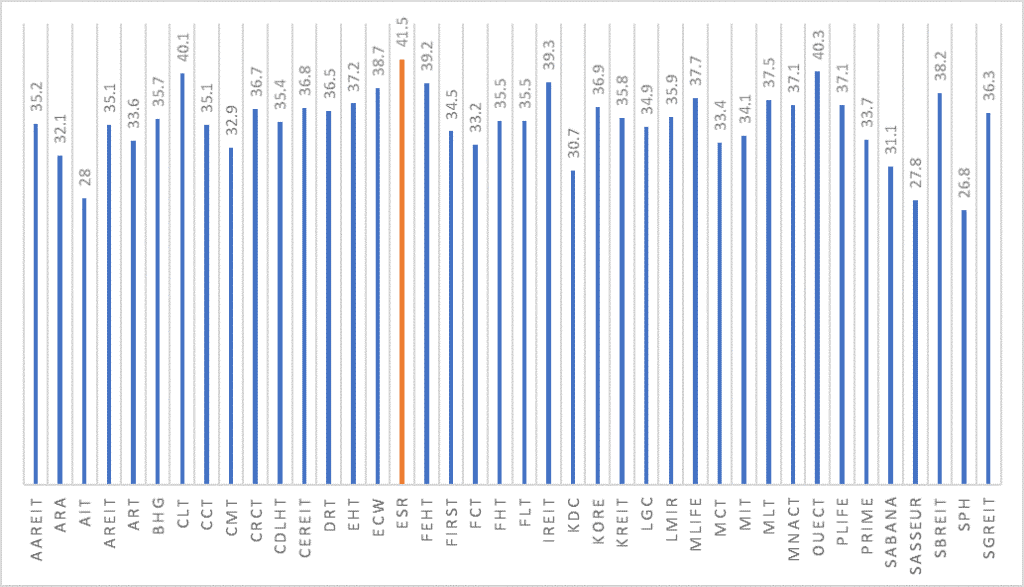
On the other hand, a REIT like ESR-REIT has one of the highest (if not the highest) gearing profile within the S-REIT community at 41.5% (as of end-2019) and while it still has 195m in debt headroom before hitting the 45% (now 50%) mandatory ceiling set by MAS, it only has undrawn committed facilities of $90m left as at end-2019.
In today’s context where “Cash is King”, a REIT with a huge cash buffer will likely increase its chance of survival.
KEY FACTOR # 7: TENANTS PROFILE
We rated diversification of tenants and asset as one of our Top 10 key quantitative metrics earlier on in Part 1 of our analysis. However, we also did highlight that one should do a level 2 analysis, evaluating the asset/tenant profile on a more in-depth basis.
Bankruptcy risk is getting increasingly real in today’s context, with COVID-19 forcing businesses worldwide to shut-down. Although Singapore has yet to mandate a country-wide lockdown (which will essentially mean the closure of most properties), the risk of such a scenario materializing remains.
Businesses without access to cash or with cash-flow problems might find themselves at risk of insolvency and this will, in turn, create a vicious loop, impacting property owners that lease the property space to them (risk of tenant defaults and low future portfolio occupancy).
A REIT that has significant concentration risks in terms of assets/tenants will find themselves vulnerable to an economic recession.
However, we did also highlight that in certain unique scenarios, a highly concentrated portfolio comprising of one or two key assets/tenants might not be as bad as it seems. We highlighted Elite Commercial Trust as an example.
Personally, any single tenant that encompass at least 10% of the REIT’s revenue should be scrutinized for potential default/loss on departure due to both systematic risks as well as industry-specific risk. For example, a REIT might have significant exposure to the Oil & Gas industry with a sizable portion of its units leased out to O&G clients. The recent oil price collapse might once again (happened back in 2014-2015) put O&G counters at risk of insolvency and potential default of their rental payments.
KEY FACTOR # 8: SPECIFIC INDUSTRY OUTLOOK
While COVID-19 is likely to impact the SG economy on all front, with no single industry likely being spared, some will be more significantly impacted than others.
For one, the hospitality industry will see a huge negative impact from the COVID-19 fallout and if one wishes to “bottom-fish” a REIT in this industry, balance sheet strength and access to capital will be the utmost importance. It might be many more months or quarters before we see the tourism industry back to normal, with travelers filling up hotel rooms.
On the other hand, suburban mall REITs such as Frasers Centrepoint Point is seen as more resilient amid COVID-19 (although its share price has been heavily sold-off the past 2-3 trading days). A weekend trip to heartland malls such as Waterway Point seems to indicate that business is “back to usual”. While no one can guarantee if the “worst is over” in Singapore (likely not), I believe Frasers Centrepoint Trust is fundamentally more resilient compared to a high-end mall such as Starhill Global REIT which is highly dependent on tourist footfall.
How to buy REITs in Singapore (DIY) summary
In Part 1 of our analysis on how to buy REITs in Singapore, I introduced 10 quantitative measures to screen out potential undervalued REITs for further evaluation. I use a simple scoring mechanism to rate the REITs, with those above 3.5 points (max of 5 points) eligible for the second round of evaluation. This is meant to quickly and efficiently screen out the “best” REITs for consideration.
While we do acknowledge that even a “bad” REIT counter has its fair value and it might make sense to purchase it if the margin of safety (the difference between market price and fair value) is sufficiently huge, it is difficult and often a subjective manner when it comes to putting a “price-tag” on a stock counter.
For the normal layman, it is better to stick with the “best-in-class” in today’s environment through a screening process like what we have introduced.
In Part 2 of our analysis, we expanded on the evaluation scope by introducing less quantitative measures such as sponsors brand/profile and future growth pipeline, access to credit line facilities, frequency of equity raising, industry outlook, etc. The time taken to evaluate REITs in Part 2 is considerably much longer.
By combining both Part 1 and Part 2, I hope to present a simple and easily understandable solution on the process one might take in considering which REITs in Singapore to buy.
With that lets now move on to the option of buying REITs through an ETF.
Buying REITs through an ETF
Buying REITs through an ETF is similar to buying individual REIT counters. They have listed products found on SGX and can be easily be bought through your selected brokerage house on a lump sum basis. For those looking at a regular savings plan option, I will also show you which are the RSP platforms available to purchase your REITs ETF.
Do note that as compared to buying individual REIT counters, buying an ETF will incur an annual expense ratio.
The table below summarises the geographical diversification of the 3 REIT ETF counters that are currently available in Singapore. Lion-Phillip S-REIT ETF is the only ETF that is purely 100% Singapore focus.

Concurrently, I also provide a brief comparison between the 3 REIT ETFs.
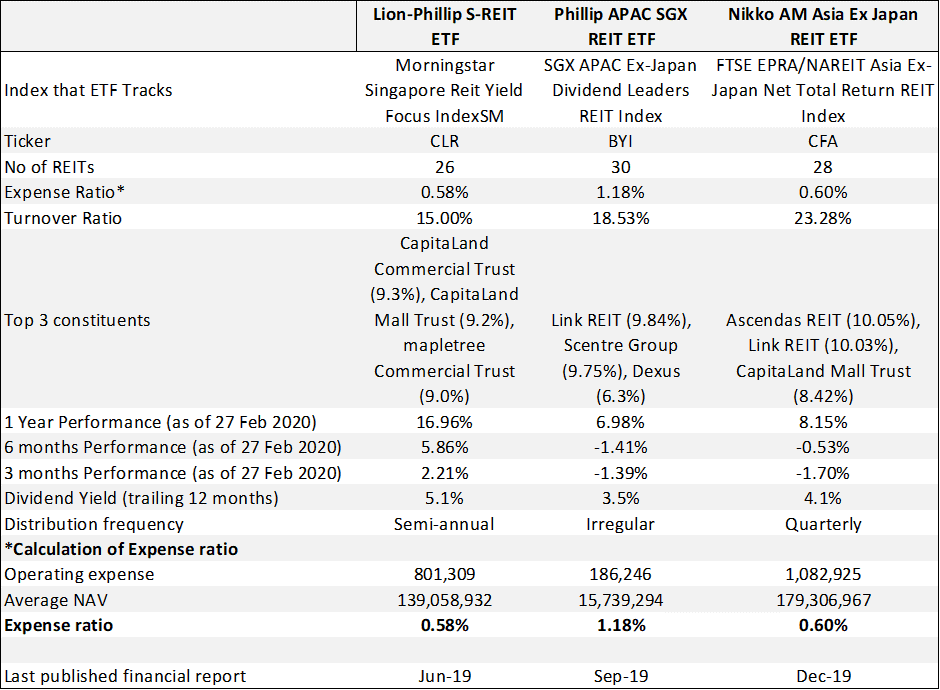
Lion-Phillip S-REIT ETF does have the lowest expense ratio at 0.58% with and Nikko AM REIT ETF at 0.60%. What is surprising is that Phillip SGX APAC Dividend Leaders REIT ETF has an atrocious annualized expense ratio of 1.18%!
This is likely attributable to economies of scale, or the lack of it. The average NAV of Phillip SGX APAC Dividend Leaders REIT ETF, based on their last financial reporting date at Sep 19 stands at only S$15.7m. The huge variance between Phillip SGX APAC Dividend Leaders REIT ETF NAV vs. its two peers, Lion-Phillip S-REIT ETF at S$139m and Nikko AM REIT ETF at S$179m came as a real surprise to me.
On a turnover basis (half-yearly), Lion-Phillip S-REIT ETF has the lowest turnover ratio among the 3 REITs at 15%. This could explain its slightly lower expense ratio vs. Nikko AM REIT ETF.
Coming to their recent performance history (based on information from FSMOne), it does seem like Lion-Phillip S-REIT ETF has been the strong performer, with outperformance recorded on a 1 year, 6-months and 3-months’ time-frame vs. its peers. This is likely due to the more resilient nature seen in S-REITs vs. Hong Kong and Australia REITs.
Last but not least, the trailing 12-months yield generated (past 12-months distribution per share / current share price as of 2 March 2020) for Lion Phillip S-REIT ETF (semi-annual distribution) is also the highest at 5.1% vs. 3.5% for Phillip SGX APAC Dividend Leaders REIT ETF (distributions have been irregular with distribution compressed by Australian taxes) and 4.1% for Nikko AM REIT ETF (distributions every quarter).
For those interested in finding out more about Lion-Phillip S-REIT ETF, I have written a detailed article on this ETF in this article: Lion-Phillip S-REIT ETF: Should you be buying this REIT ETF?
Using the Regular Savings Plan method to purchase REIT ETFs
To purchase REIT ETFs through an RSP method (instead of lump-sum), there are currently 4 platforms that are available which is shown below.
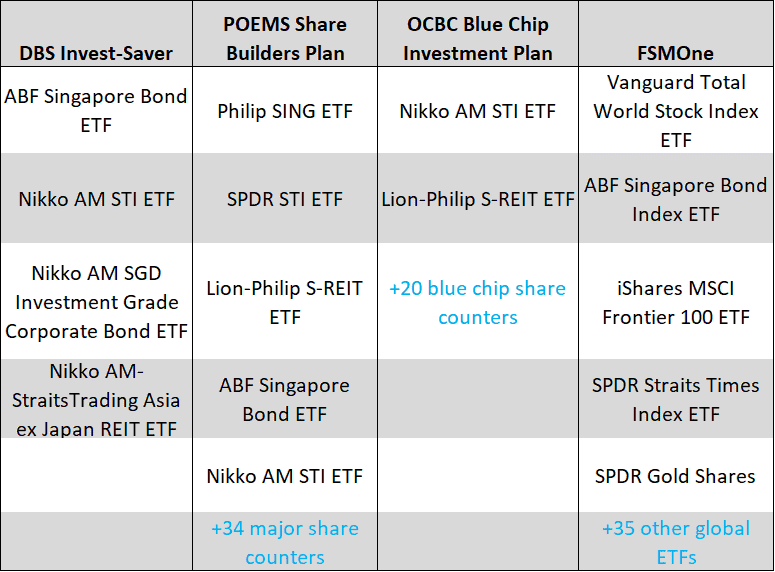
The Phillip APAC SGX REIT ETF doesn’t seem to have an option for RSP investment, likely due to its small size.
For those looking to purchase Lion-Phillip S-REIT ETF on an RSP basis, you can buy them through POEMS Share Builders Plan or OCBC Blue Chip Investment Plan.
For Nikko AM Straits Trading Asia ex Japan REIT ETF, that product can be purchased through DBS Invest-Saver.
I have previously written that FSMOne is the cheapest option to purchase ETFs in a RSP manner. However, there is no Singapore REIT ETFs available on its platform.
How to buy REITs in Singapore (Through ETF) summary
Buying REITs through an ETF, like the ones highlighted above is a good way to diversify your exposure if you do not wish to select individual REITs for investment on a DIY and will prefer broad-based diversification.
Investing in Lion-Phillip S-REIT ETF enables one to concurrently have exposure to 26 of the best REITs in Singapore and is 100% Singapore focus whereas the other two REIT ETFs compose of REITs listed in other geographical locations such as Hong Kong and Australia.
Buying REIT ETF on a lump sum basis is similar to purchasing individual stock counters as ETFs are products listed on the SGX. For those looking to invest in REITs through an RSP manner, one can do so using DBS Invest Saver (for Nikko AM REIT), POEMS Share Builder Plan (for Lion-Phillip S-REIT) and OCBC Blue Chip Investment Plan (for Lion-Phillip S-REIT).
Buying REITs through a Robo Advisor
Syfe introduced its REIT+ and 100% REIT portfolio recently. You can read more about it in this link.
I believe this portfolio structure will be pretty popular with Singapore investors, given our love for all things REITs.
I think it is one of the most affordable option to invest in a basket of selected high-quality REITs. The REIT+ portfolio has no minimum investment and fees start from 0.4%, going up to 0.65% for those with less than S$20k in AUM. This is all the fees you will incur as Syfe is not investing in REITs ETF which will incur another layer of fund expense fee.
This recurring fee structure is pretty similar to investing with the 3 REIT ETFs available in Singapore on a DIY-basis where the total expense ratio is somewhere in the region of 0.60%. However, one-off transaction fees (commissions, SGX Fees, etc) will not be incurred in the case of Syfe.
For more information on buying REITs through Syfe, I have written a Guide on Syfe which includes opening an account in less than 10 minutes as well as an evaluation of its performance in today’s volatile market.
Section 3 summary:
When it comes to buying REITs in Singapore, it can be through the DIY option of selecting individual REIT counters to invest. In Part 1, I have provided you with a quick screening methodology that acts as an initial filter. I use a scoring system that ranks all the REITs out of a maximum of 5 points, with 3.5 points as the minimum benchmark to proceed to Part 2. In Part 2, I introduce 8 additional qualitative factors to consider.
Alternatively, one can also purchase REITs through a REIT ETF. There are currently only 3 REIT ETFs available in Singapore, with the most popular and liquid one being the Lion-Phillip S-REIT ETF.
Lastly, instead of buying REITs through an ETF, one can do so through a Robo Advisor like Syfe REIT+ and a 100% REIT portfolio.
Section 4: Top REIT counters to buy today
Method 1: Selecting REITs using our REIT comparison table
This webpage provides a comprehensive list of REITs in Singapore and the latest Singapore REIT comparison data such as the Latest Price, Dividend Yield, Price/NAV and gearing level, etc.
Based on my scoring system which scores the Singapore REIT universe out of a maximum of 5 points, there are currently 10 REITs that score 3.5 points and above.
These 10 REITs are:
- Ascendas India Trust (Office + Logistics)
- Ascott Residence Trust (Hospitality)
- CapitaLand Commercial Trust (Office + Retail + Hospitality)
- CapitaLand Mall Trust (Retail + Office + Logistics)
- Cromwell European REIT (Office + Industrial + Logistics)
- First REIT (Healthcare + retail)
- Frasers Logistics & Commercial Trust (Industrial + Logistics + Office)
- Keppel DC REIT (Data Centre)
- Lendlease Global Commercial REIT (Retail + Office)
- SPH REIT (Retail)
REITs for consideration to buy
Among the large-cap REITs, CapitaLand Commercial Trust and CapitaLand Mall Trust are interesting considerations for Part 2 of evaluation. The combined entity, once completed, will be the largest REIT in Singapore and will enjoy substantial economies of scale as well as the benefit of lower borrowing costs.
Within the small/mid-cap REITs category, the now enlarged Frasers Logistics & Commercial Trust with a total of 86 properties across its portfolio is also a worthy consideration candidate.
Keppel DC REIT, one of the most resilient REIT counters in today’s context, also did very well in our scoring system, largely due to its growth factor.
Cromwell European REIT might also be an interesting mid-cap REIT to consider, particularly if the worst of COVID-19 is over in Europe.
Ascendas India Trust has significant geographical risk given that its properties are based in India which is likely still in the early stage of COVID-19. However, its properties are mainly IT and logistic Parks which are likely to be seen as resilient, hence, I believe the counter is worthy of a second look.
Lastly, I will also look at Lendlease Global which has a very concentrated investment portfolio of only 2 assets, one being 313@somerset (a prime retail building in Singapore) and the second Sky Complex in Milan (Grade A office in Italy). The downside of this counter is its significant exposure to high-end retail.
REITs not within further consideration
I have previously done the 2-Part evaluation of SPH REIT with the conclusion that I will not be investing in the counter at the moment. The article can be found here.
First REIT, while in an attractive industry similar to Parkway, is not in my consideration list due to its Indonesia exposure which is an area that I am personally not comfortable with. Moreover, the COVID-19 situation in Indonesia is likely still in the early stages unlike developed countries such as Europe.
Lastly, I will also look to avoid hospitality REITs at the moment, therefore Ascott Residence Trust is not in my consideration list as there is still a huge amount of uncertainty about the resumption of the tourism/serviced apartment industry in Singapore. However, if the counter declines further, there could be bottom-fishing opportunities.
Method 2: Selecting REITs based on Price fall relative to 2020 DPU decline
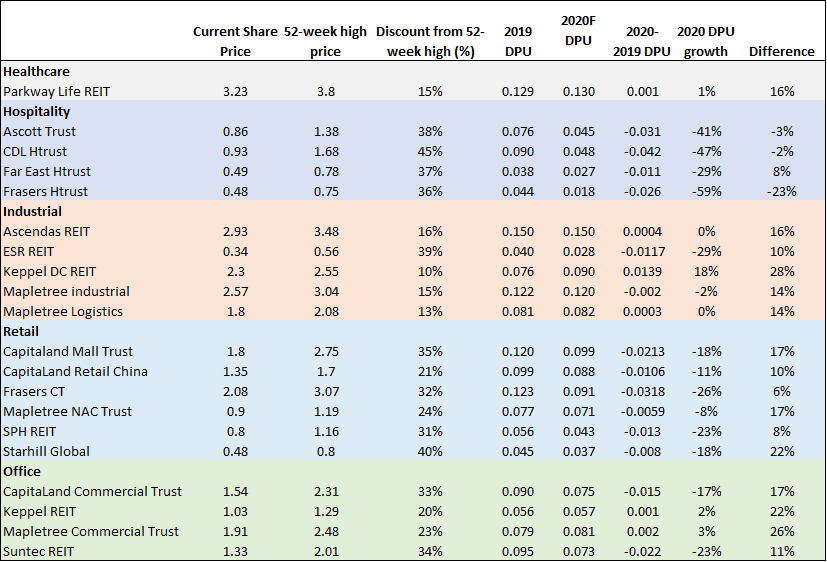
A second method which can be used to select REITs is through a combination of both price actions (how much the REIT has declined from its 52-week level) and the REIT business fundamentals (how much 2020/21 DPU is forecasted to decline from 2019/20 level by the street).
Some investor might choose to buy into REITs based on the magnitude of their share price decline, arguing that the greater the fall equates to more value. However, very often the larger than “normal” fall in share price is due to the fact that the counter’s business fundamentals is more significantly affected than its peers.
Take for example CDL Hospitality Trust. It has declined 45% from its 52-week high. Comparatively, Keppel DC REIT has only declined by 10%. Purely focusing on price action, one might find more “value” in CHL Hospitality Trust compared to Keppel DC REIT.
However, CDL Hospitality Trust is expected to see its DPU slashed by 47% in 2020 whereas Keppel DC REIT is expected to grow its DPU by 18%. There might be a strong justification case to purchase Keppel DC REIT over CDL Hospitality Trust.
Based on this method, some of the REIT counters worthy of consideration include:
- Parkway Life REIT
- Keppel DC REIT
- Ascendas REIT
- CapitaLand Mall Trust
- Mapletree NAC Trust
- Starhill Global
- CapitaLand Commercial Trust
- Keppel REIT
- Mapletree Commercial Trust
Method 3: Selecting REITs based on the street recommendation and TP
SGInvestors has compiled a list of S-REITs with their respective ratings and a target price (average target price among the brokers) on this webpage for your consideration.

The Top 5 REITs with the highest TP upside based on the street estimates are:
- Lippo Malls Indo Trust (1 Analyst coverage with 1 Buy rating) – Upside: 65.5%
- ARA US Hospitality Trust (1 Analyst coverage with 1 Buy rating) – Upside 64.7%
- Lendlease Global (1 Analyst coverage with 1 Buy rating) – Upside 63.5%
- Manulife US REIT (4 Analysts coverage with 4 Buy rating) – Upside 49.3%
- ESR REIT (4 Analysts coverage with 4 Buy rating) – Upside 49.3%
I would be cautious of those REITs with only 1 analyst coverage with a high TP upside.
Conclusion
I have provided a pretty detailed Guide to REITs in Singapore for a new investor who wants to learn more about the basics of REITs, the current REITs landscape, and how to go about investing in this asset class.
REITs as an investment asset class here in Singapore will continue to remain as an attractive passive income option for Singaporeans.
While the global REIT industry is undoubtedly undergoing its worst crisis since the GFC, the fundamentals of REITs in today’s context are in a much stronger footing as compared to a decade ago.
While there is no certainty that all the REITs in Singapore will survive this health-crisis, I have no doubt that the blue-chip REITs will not only be among the survivors but will also emerge out of this crisis stronger as they capitalize on acquiring assets on the cheap.
Do Like Me on Facebook if you enjoy reading the various investment and personal finance articles at New Academy of Finance. I do post interesting articles on FB from time to time which might not be covered here in this website.
Join our Telegram broadcast: https://t.me/gemcomm
SEE OUR OTHER WRITE-UPS
- DIVIDENDS ON STEROIDS: A LOW-RISK STRATEGY T10 GREAT REASONS TO BUY REITS AND 3 REASONS TO BE CAUTIOUS [UPDATE 2020]
- HOW TO BUY REITS IN SINGAPORE. 10-KEY S-REIT QUANTITATIVE FILTER (PART 1)
- WHY I AM STILL BUYING REITS EVEN WHEN THEY LOOK EXPENSIVE
- HOW TO BUY REITS IN SINGAPORE. 8 ADDITIONAL FACTORS TO CONSIDER (PART 2)
- THE BEST PREDICTOR OF STOCK PRICE PERFORMANCE, ACCORDING TO MORGAN STANLEY
- BEST PERFORMING SINGAPORE REITS AMID CURRENT MARKET VOLATILITY



2 thoughts on “Ultimate Guide to REITs in Singapore (2020)”
Thank you for the detailed analysis.