
Singapore Banks benefitting from Fed tightening?
For the first time since 2018, Jerome Powell (Chairman of The Fed) raised interest rates for the US by 25 bps (0.25%) to 0.25-0.50%. In addition, The Fed is looking to increase the pace of its tightening by increasing interest rates by 50 bps (0.50%) in May as part of it raising interest rates 8 more times for 2022. It has an intended goal of raising interest rates to 2-2.5% by 2023.

With announcements made that the Fed is also looking to unwind its balance sheet of securities (Mortgage-backed securities and treasury bills) which further tightens financial conditions, a new regime of a “higher interest rate” environment might finally be dawning upon us. Is the higher interest rate environment going to be beneficial to the 3 Singapore Banks and which of the 3 Singapore banks currently has the most value, in my view?
In this article, I will be running you through 6 financial metrics that I used to evaluate the attractiveness of banks.
Impact on your portfolio
An increase in interest rates and financial tightening means that borrowing costs would increase which would hinder companies’ ability to raise financing and would also increase their debt payments to lenders.
As such, I would look to use this recent strong bounce in the share prices of unprofitable companies and companies with high/unsustainable debt loads as an opportunity to trim my exposure in these names.
On the other hand, an industry to consider having a greater allocation ahead would be the financial sector, particularly the banking industry.
Banks
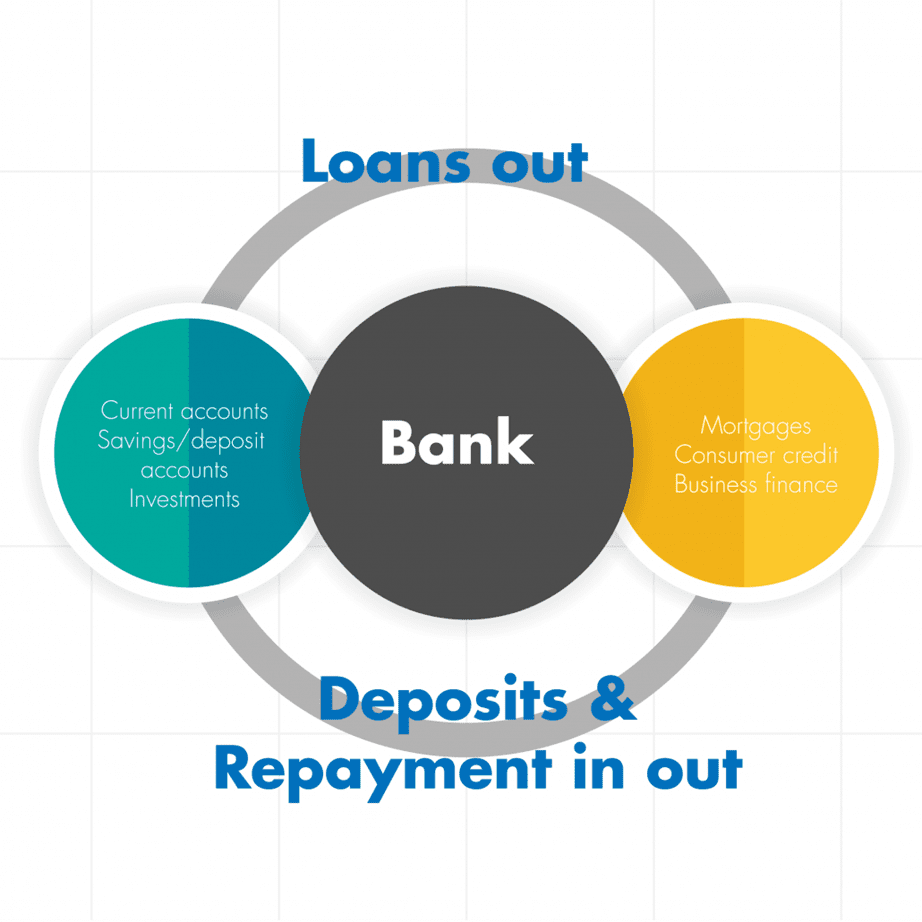
A bank makes a significant amount of money (interest income) by capturing the yield spread between its borrowing cost (example: short-term borrowing costing 1%) and its cost of lending (example: longer-term borrowing costing 3%).
Banks are direct beneficiaries of higher interest rates in general as their borrowers would pay a higher amount of interest for the loans that they obtain from banks which leads to higher interest incomes earned by these banks.
One can look to hedge against higher interest rates by investing in banks. But how do you know if the bank is trading at a good value now?
Here are some important key metrics I would evaluate for a bank before I would consider starting a position in the bank:
Key Metrics of Banks:
1. Diversified Loan Portfolio:
Banks derive a significant amount of their income from lending money to companies and individuals. As such, you want a bank to have a diversified loan portfolio, with the bank’s loans not dominated by any single industry.
This is important as a bank would be at “high risk” if its loan portfolio is heavily skewed to a particular industry. When that industry experiences a severe downturn, it could result in many companies (in that industry) facing financial difficulties and the potential of defaulting on their borrowings.
Hence, a diversified loan portfolio is paramount for a bank.
2. Quality of Loans (Non-performing loans – NPL):
Banks need to make loans where there is a significant chance of the lenders being able to repay their loans when they come due. A metric to assess the quality of loans is the non-performing loans ratio (NPL ratio).
This measures the percentage of loans made that are defaulted by lenders (interest of principal payments not made within a period). A lower NPL ratio means the bank makes better quality loans.
3. Net Interest Margin (NIM):
This measures the “yield capture” or “profit” earned by the bank when it lends money out after taking into account the cost of obtaining the money (interest paid for deposits). A bank obtains short-term deposits from customers (individuals and corporations) by paying interest for deposits (say 1%).
It then lends out the deposits obtained at an interest rate of 3% to borrowers on a longer-term basis. This way the bank earns 2% on the money loaned out. A high NIM is good but a bank should be cautious of having too high a NIM compared to its peers as it might lose customers to its competitors who charge lower interest rates to borrowers.
4. Growth in Deposits
As mentioned above, a significant contributor to a bank’s income is the interest it charges on lending out its customers’ deposits.
By growing its deposits, a bank would have more money to lend out to borrowers which in turn grows its interest income. As such, we would want our banks to have a track record of growing their deposits over the years.
5. ROA / ROE / Dividend Yield
ROA (Return on assets) measures how well a bank is using its assets to make money. The higher the ROA, the better. A bank with a ROA of above 1.3% is good.
ROE (Return on equity) measures how well the bank is using its shareholders’ money to make profits. The higher the ROE, the better.
Finally, we want banks that have a dividend yield that is above the 10-year interest rate of bonds. A dividend yield above 3% provides a sufficient buffer.
6. Leverage Ratio (Tier 1 Capital Ratio)
Tier 1 Capital Ratio is the ratio of a bank’s capital (equity capital and disclosed reserves) to its total risk-weighted assets. This measures the bank’s financial strength and its ability to withstand financial distress before it becomes insolvent. A tier-1 capital ratio of 6% is deemed adequate.
Now, let us examine how the 3 banks in Singapore fare under these 6 metrics.
DBS Bank
- Diversified Loan Portfolio:
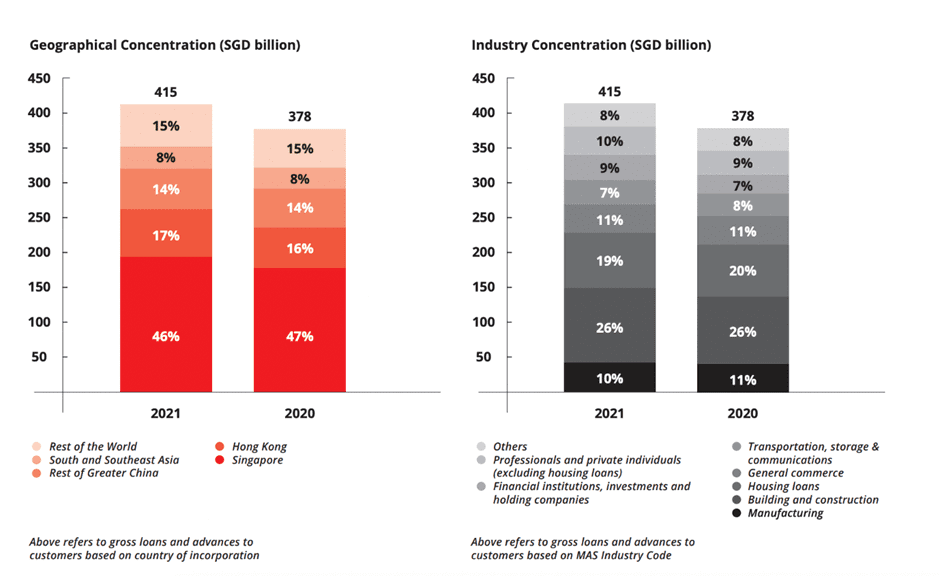
DBS’s largest exposure in terms of geography and industry are Singapore and the Building and Construction industry respectively. The next industry that it has a significant concentration is the housing loans industry. It is slightly worrying that it has outsized exposure to the real estate industry (the majority of exposure is likely to be in Singapore and HK).
A downturn in the real estate industry might have a severe impact on DBS’ loan book. The rest of the loan portfolio is adequately distributed among other industries.
- Quality of loans – NPL
DBS has an extremely low NPL of 1.3. This means that DBS makes excellent decisions in terms of deciding which customers to make loans as only a minuscule number of lenders default on their loans.
- NIM
DBS has a NIM of 1.45. While this is rather low, I expect this ratio to increase over the coming years as the Fed increases its interest rates which should result in DBS raking in higher amounts of interest income at the same time.
This would be ideal on the assumption that the high-interest rate environment does not translate into higher NPL loans as businesses faced financial difficulties.
- Growth in Deposits
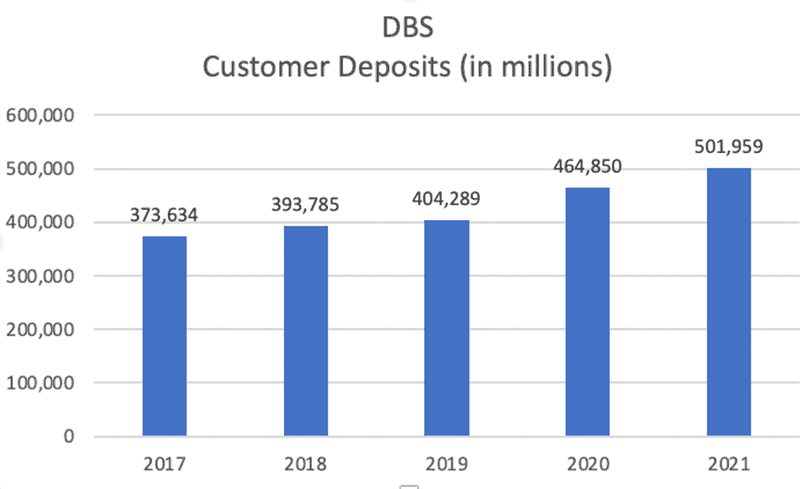
DBS does an excellent job in growing its customer deposits over the past 5 years from $373+ billion to $501+ billion. That is a CAGR of 6.08% per year.
- ROA / ROE / Dividend Yield
DBS has an acceptable ROA of 1.02%, a strong ROE of 12.5%, and a decent dividend yield of 3.33% at present
- Leverage Ratio (Tier 1 Capital Ratio)
DBS has a Common Tier 1 Capital Ratio of 14.4%. This is more than 2x of an adequate ratio of 6%. This means that DBS is in excellent financial shape and is well capitalized to withstand financial distress before it becomes insolvent.
OCBC Bank
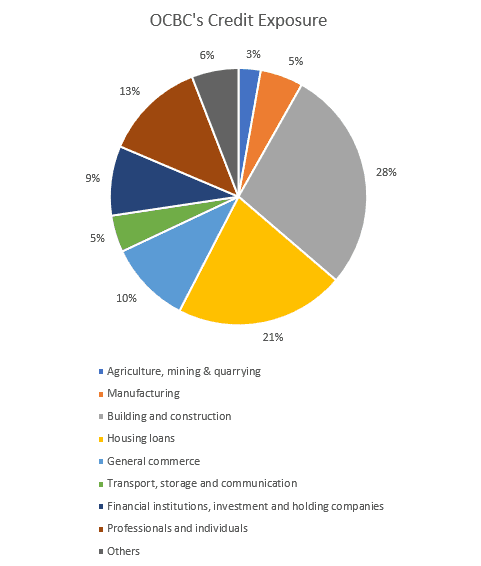
- Diversified loan portfolio:
OCBC’s largest exposure in terms of geography and industry are Singapore and Building and Construction respectively which is similar to that of DBS’s loan portfolio composition.
Just like DBS, housing loans are its 2nd largest loan exposure with the remaining 51% of its loan book diversified across 7 other industries/sectors.
- Quality of loans: NPL
OCBC has a low NPL of 1.5 which is slightly higher than DBS’s 1.3 but nothing to be too concerned about at present.
- NIM
OCBC has a NIM of 1.54 which is slightly higher than that of DBS. Again, this metric should improve over time as we adjust to a higher interest rate environment, which is positive for banks, assuming again that profits generated from a higher interest environment are not being offset by increased loan defaults.
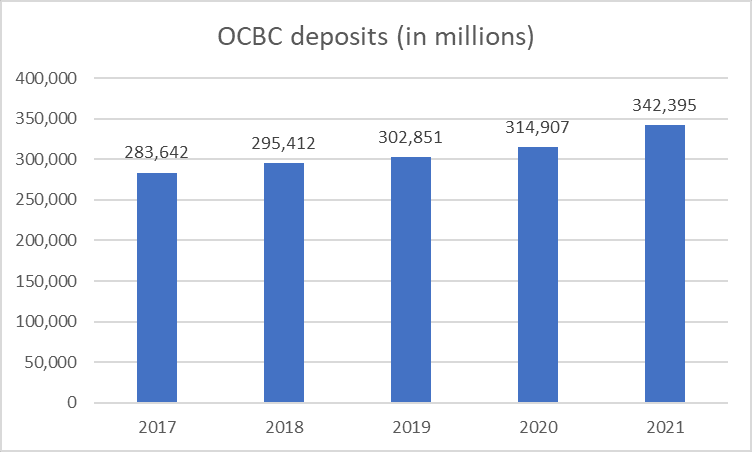
- Growth in Deposits.
OCBC does an okay job in growing deposits from $283+ billion to $342+ billion in the past 5 years. That works out to a CAGR of 3.86% per year, which isn’t as fantastic as DBS.
- ROA / ROE / Dividend Yield
OCBC has a strong ROA of 1.13% and a rather low ROE of 9.60%. It has a strong dividend yield of 4.27% which explains why it is popular among dividend income seekers at present
- Leverage Ratio (Tier 1 Capital Ratio)
OCBC has an outstanding Common Tier 1 Capital Ratio of 15.5%. This is more than 2x of an adequate ratio of 6%. This means that OCBC is in excellent financial shape and is well capitalized to withstand financial distress before it becomes insolvent.
UOB Bank

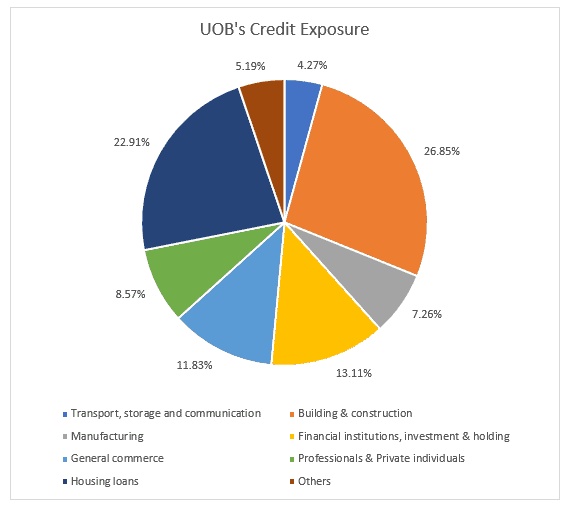
- Diversified loan portfolio:
Similar to both DBS and OCBC, UOB’s largest loan exposure in terms of geographical sector is Singapore while also having the largest exposure to the Building and Construction industry.
- Quality of loans: NPL
UOB has a low NPL of 1.6. This is the highest among the 3 local banks.
- NIM
UOB has a NIM of 1.56 which is similar to that of OCBC.
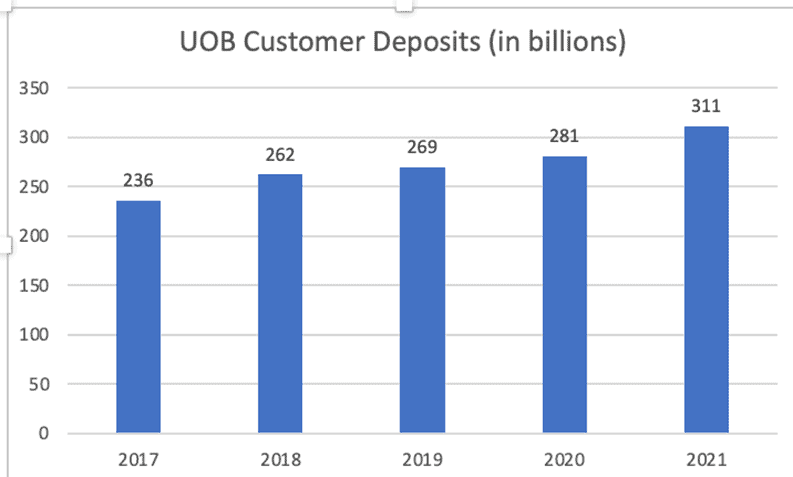
- Growth in Deposits.
UOB does a poor job in growing deposits from $273+ billion to $311+ billion in the past 5 years. That works out to a mere CAGR of 2.64% per year, way lower than that of DBS.
- ROA / ROE / Dividend Yield
UOB has a poor ROA of 0.9% and a rather average ROE of 10.20%. It has an acceptable dividend yield of 3.75%.
- Leverage Ratio (Tier 1 Capital Ratio)
UOB has a strong Common Tier 1 Capital Ratio of 13.5%. This is more than 2x of an adequate ratio of 6%. This means that UOB is in excellent financial shape and is well capitalized to withstand financial distress before it becomes insolvent.
Comparison of Banks & Current Valuation:
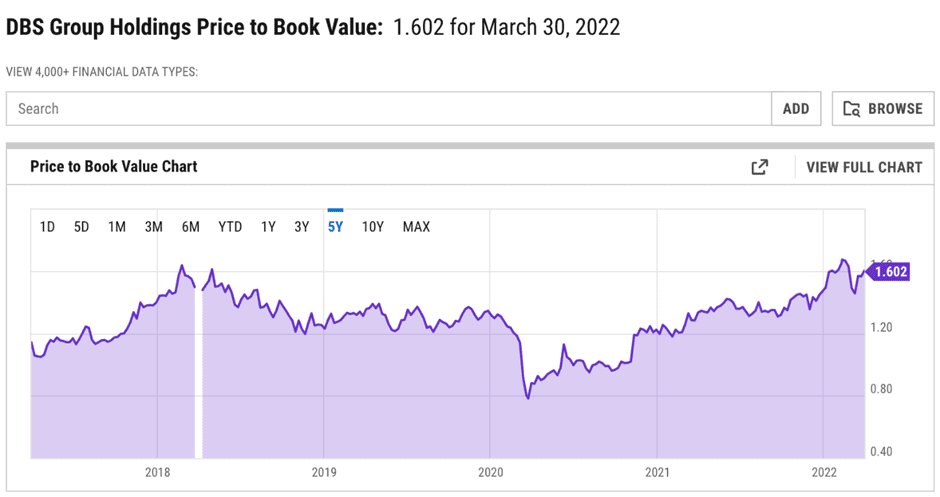
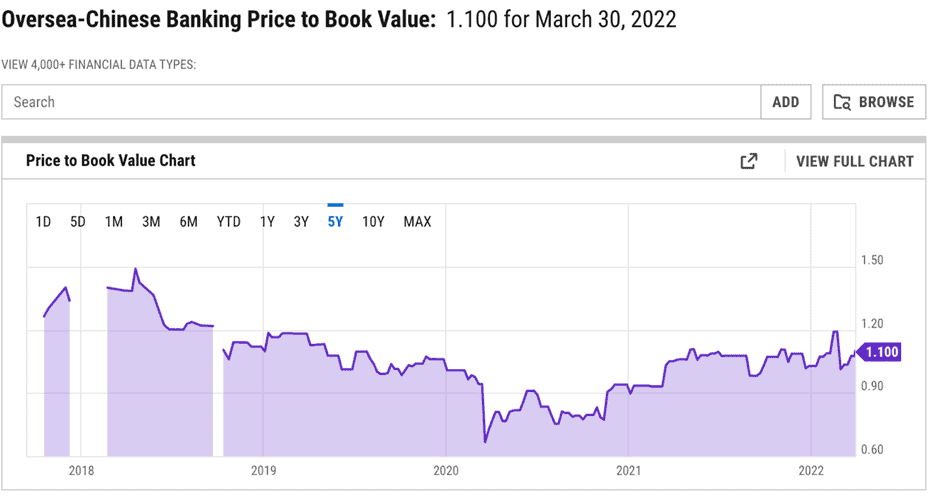
DBS trades at a current valuation of 12.36 forward P/E and a P/B of 1.61. OCBC trades at a current valuation of 10.26 forward P/E and a P/B of 1.09. UOB trades at a current valuation of 11.47 forward P/E and a P/B of 1.26.
UOB trades at a premium while its metrics rank poorer compared to both OCBC and DBS. Hence, I am not that interested in the name based on the above metrics I used for evaluation. That leaves me with OCBC and DBS.
DBS trades at a 5-year historical premium but with good reason. It is by far the strongest bank in Singapore with the largest number of customer deposits and loans under its belt.
Hence, it will likely earn an outsized amount of interest income as the interest rate marches higher. Other metrics such as NPL, ROE, and ROA compare favorably to both OCBC and UOB. It is currently my personal favorite for exposure to the banking industry and a cyclical exposure to Singapore’s economy.
One major “downside”, however, is that DBS currently has the lowest dividend yield (at 3.3%) among the 3 banks
OCBC trades at a more attractive 5-year valuation compared to DBS. It also offers a higher dividend yield of 4.27% compared to DBS. OCBC might be more suitable for less risk-averse investors who would like a solid dividend yield. It would have less potential capital upside compared to DBS but it would also be less volatile compared to DBS, in my view.
Potential Risk
It is important to note that banks carry a heavy cyclical risk. An impending recession would likely result in significant share prices depreciation as the market anticipates a higher number of borrowers being unable to repay their loans.
Also, all 3 Singapore banks have huge exposure to the real estate industry in Singapore. A downturn in that industry (potentially triggered by rising mortgage costs) would hurt all the 3 banks.
The current US yield curve inversion environment has 2 negative implications on banks. First, it is often an early indication that a recession might be on hand.
Second, it might negatively impact the earnings of banks as this industry works on the premise of borrowing short term and lending out long term. If part of its short-term borrowing costs is now more expensive than its longer-term loans, that will eat into the profitability of banks.
Conclusion:
Personally, OCBC looks to be the most attractively valued company among all 3 banks after considering the above-mentioned 6 financial metrics. While DBS has demonstrated the highest growth potential when it comes to increasing its deposit base, this might become a “problem” if the yield inversion scenario gets more pronounced.
I might look to start a position in OCBC now to hedge against the imminent higher interest rate environment and potentially dollar-cost average into the counter, assuming the above-highlighted risks (on banks) have got a minimal impact on its earnings generation profile.
Once again, this is by no means a recommendation to be buying/selling on any of the above 3 highlighted bank stocks in this article. Please engage in your due diligence process and do note that there are always risks involved when buying into an individual stock counter.
Do Like Me on Facebook if you enjoy reading the various investment and personal finance articles at New Academy of Finance. I do post interesting articles on FB from time to time that might not be covered here in this website.
Join our Instagram channel for more tidbits on all things finance!
Join our Youtube channel for short and sweet videos on all things finance!
SEE OUR OTHER WRITE-UPS
- Best Dividend Growth Stocks: How to become a millionaire by investing in these 6 dividend growth stocks
- How to double dividend yield using this simple strategy
- Top 5 Undervalued Small-Cap Singapore Dividend Stocks (>4% yield) (2021)
- Strong Dividend Growth Stocks Increasing Dividends by up to 19% in 2020
- 6 Blue-Chip Dividend Growth Stocks with High Dividend Growth Rate
- A list of “Best” Dividend Growth Stocks
Disclosure: The accuracy of the material found in this article cannot be guaranteed. Past performance is not an assurance of future results. This article is not to be construed as a recommendation to Buy or Sell any shares or derivative products and is solely for reference only.


