We have written in a previous article why a 60:40 equity to bond portfolio composition (Portfolio 1) isn’t the ideal structure for a retirement portfolio using the 4% withdrawal rule. Instead, we suggest using a portfolio structure that consists of 20% equity, 20% bond, 40% REITs and 20% Gold (Portfolio 2). In this article, we suggest a 3rd portfolio comprising 10 equity stocks that blows the competition away.
Before that, let’s briefly recap what we previously discussed pertaining to our ideal retirement portfolio aka Portfolio 2.
Using our recommended structure under Portfolio 2 would have generated an average real CAGR of 7% vs. Portfolio 1 average real CAGR of 6.3% since 1970.
More critically, Portfolio 2 would have allowed for a Safe Withdrawal Rate of 6.4% vs. Portfolio 1 Safe Withdrawal Rate of only 4.2%.
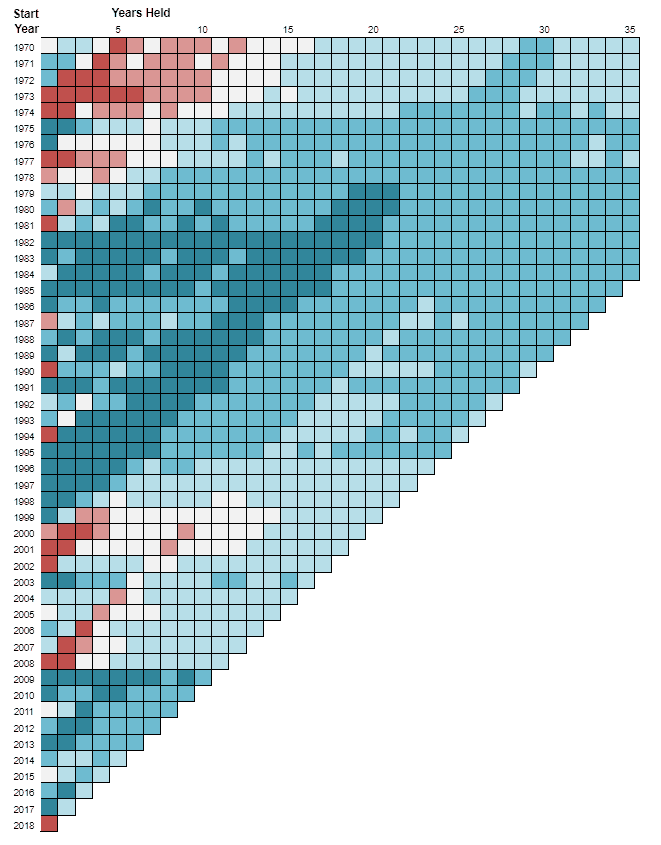
We showcase the performance heatmap of both Portfolio 1 and Portfolio 2.

Portfolio 1 Heat Map
Portfolio 2 Heat Map
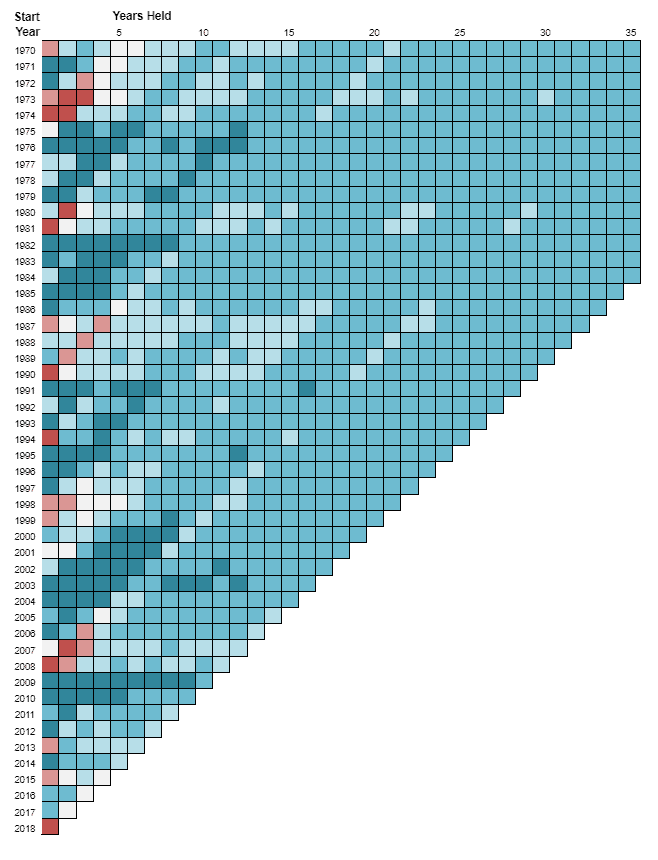
Notice that the variability of Portfolio 1 is much more volatile compared to Portfolio 2, particularly in the 1970s where there are more “red patches” (representing negative returns) for Portfolio 1 compared to Portfolio 2.
However, in a strong bull market like from the 1980s to the late-1990s, Portfolio 1 would have generated stronger annualized returns compared to Portfolio 2, as seen from more “dark blue patches”, representing returns greater than 9%.
How did both portfolios perform during GFC compared to the broader market?
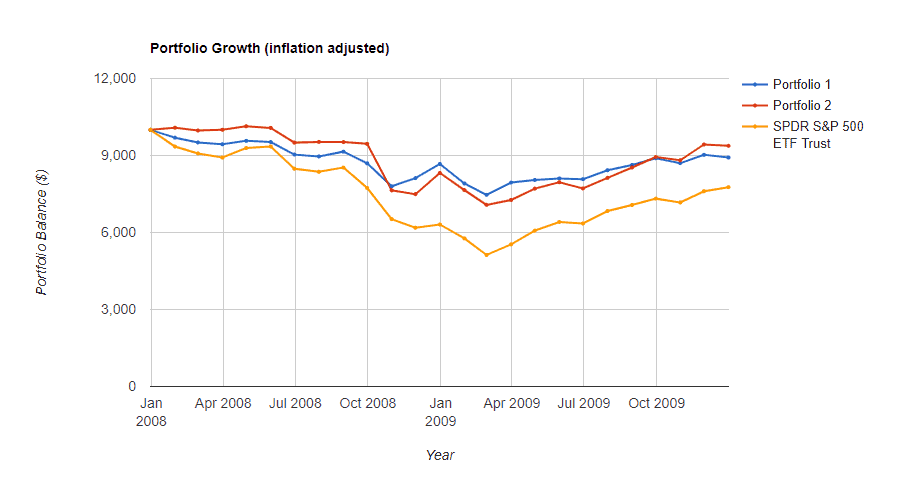
If one invested in Portfolio 1 at the peak of the GFC (beginning of 2008), the real returns would have been -13% in 2008, improving to +3% in 2009 for a CAGR of -5.5% over 2 years
Portfolio 2 would have generated real returns of -17% in 2008 and +13% in 2009 for a CAGR of -3% over 2 years
Comparatively, the market would have declined by more than -37% in 2008 but rebounded by 26% in 2009 for a CAGR of -12% over 2 years
Interim conclusion
If one’s aim is for capital preservation, we maintain our original conclusion that a portfolio structure based on Portfolio 2 is a superior one compared to the more traditional Portfolio 1 structure comprising of 60% equity and 40% bonds.
Over a long horizon, Portfolio 2 has demonstrated that it is able to withstand economic downturns much better than Portfolio 1, particularly in an inflationary environment such as in the 1970s where gold, as part of one’s portfolio composition, has shone greatly.
According to data from Portfoliocharts.com, gold generated an annualized real return of 22% from 1971 to 1981, the key reason why Portfolio 2 demonstrated much stronger portfolio stability during inflationary climates like in the 1970s and economic uncertainty like from the early 2000s up till 2013.
While we have demonstrated that Portfolio 2 might be the ideal Portfolio structure to own, especially when one might be close to the tail-end of a decade long bull market, can we actually create a customized portfolio comprising 100% of individual equities that is able to stand a downturn much better than Portfolio 2?
The ideal equity portfolio
Instead of buying into an equity index ETF which mimics the performance of the index itself, might one be better off structuring a portfolio of individual US equities that can better withstand the drawdown of an economic downturn and yet also substantially outperform the index during the bull market?
Famed master stockpicker Peter Lynch recently commented in this Barron’s article that if you only invest in an index ETF, you will never beat it. He believes that active investing still matters and reiterates his mantra: Buy stocks, regardless of whether things look rosy or bleak.
“The thesis underlying everything, whether you are an actively managed fund or passive fund is that the U.S. will be ok. If you don’t believe that, you should not be in the stock market”
Peter Lynch
So I look to create a portfolio of 10 US equities (let’s call it Portfolio 3) that actually generated positive returns during the height of the GFC in 2008. This portfolio of 10 stocks continue to outperform the broader index by almost 9 percentage points from 2007 to 2019 (ie the real return is 15.4% for Portfolio 3 vs. 6.5% for SPY ETF)
A $10,000 fund invested in Portfolio 3 in 2007 would have turned into $81k by YTD2019 compared to $29k if vested in the SPY ETF.
How would Portfolio 3 stand up against Portfolio 2?
Can a portfolio of 10 equity stocks beat our ideal retirement portfolio structure comprising 20% equity, 20% bond, 40% REITs and 20% Gold that has shown to withstand significant economic uncertainty?
Let’s use a time period from 2000 to 2007 as an example.
During this period, Portfolio 2 performed well, generating an annualized real return of approx. 9%. Despite the broader US market collapsing from the height of the technology bubble in the early 2000s, REITs and Gold assets performed outstandingly during this period which helps to buffer against weak equity performance.
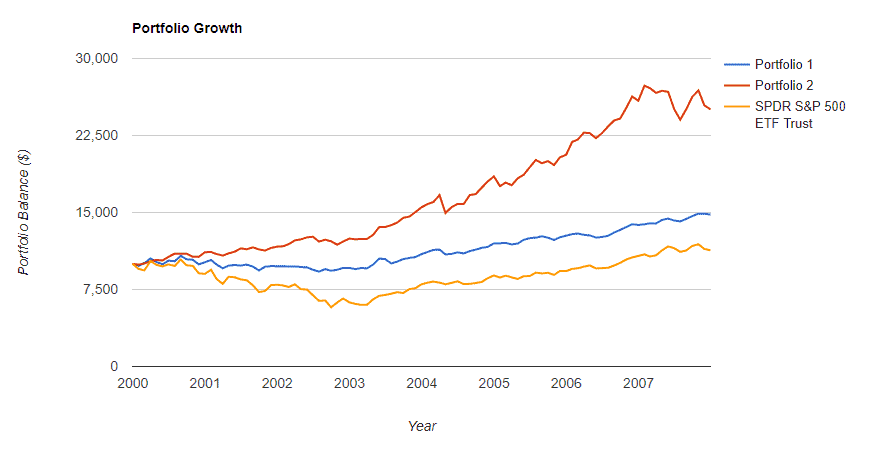
For comparison basis, Portfolio 1 (60% equity and 40% bonds) would have generated a real CAGR of 2% during this period while the broader market would have a CAGR of -1%.
So how did Portfolio 3 perform?
This portfolio generated a real CAGR of 9.3%, which is pretty comparable to that of Portfolio 2. Not particularly outstanding but decent enough in our opinion when most equity counters were cratering due to the tech bubble in the early years of the 2000s.
The beauty of Portfolio 3 becomes particularly evident when we extend the period to cover the GFC.
Recall that we mentioned that in spite of the robustness of Portfolio 2, it also witnessed a drawdown of -17% in 2008 before rebounding by +13% in 2009.
The strong performance seen in Gold was not able to offset weaknesses in both REITs and Equity in 2008. Consequently, the real CAGR of Portfolio 2 declined to approx. 6.5% from 2000-2009 vs. 9% from 2000-2007.
Portfolio 3 generated real returns of +5% in 2008 and +17.5% in 2009. Consequently, the real CAGR of Portfolio 3 actually increased to 10.2% for the period 2000-2009 compared to 9.3% from 2000-2007.
Can Portfolio 3 outperform in a bull market?
Comparing based on bull market data (ie from 2009 to 2019), the broader market represented by SPY generated real CAGR of 12.3% while Portfolio 3 (shown as Portfolio 1 in the diagram below) generated a real CAGR of 18.9%. Portfolio 2 trailed with real returns of only 8.9%.
A sum of $10k invested in Portfolio 3 in 2009 will turn into $66k (inflation-adjusted) after 10 years while $10k invested in the SPY index will turn into $35k after adjusting for inflation.
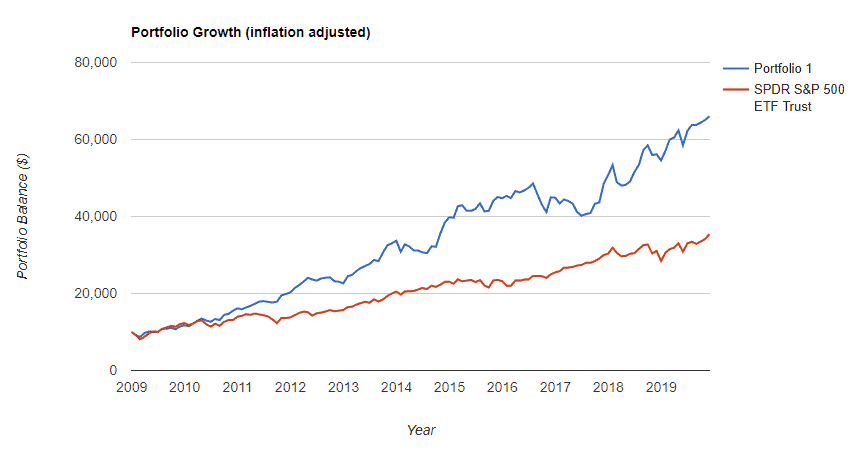
So far, it seems like Portfolio 3 is the superior one during both periods of economic weakness/ uncertainty and economic growth. However, this data only dates back to the mid-1990s, hence in periods of huge inflation like in the 1970s, it is uncertain if Portfolio 3 will continue to outperform Portfolio 2, the latter likely benefitting from its significant gold composition in such an environment.
So what are the stocks that makeup Portfolio 3
So we now come to the “highlight” of this article, disclosing the 10 stocks that beat the market and our “ideal” retirement portfolio structure in an up or down market over the past 2 decades. The 10 stocks that make up this list are:
- Walmart (WMT)
- Ross Stores (ROST)
- Tractor Supply Company (TSCO)
- Bristol-Myers Squibb Company (BMY)
- Autozone (AZO)
- WD-40 Company (WDFC)
- Nike (NKE)
- Automatic Data Processing, Inc (ADP)
- Dollar Tree (DLTR)
- Lowe’s Companies, Inc (LOW)
A combination of these 10 stocks actually generated a positive return of 5% in 2008, the height of the GFC when the broader stock market cratered by more than 37%.
Not only that, this portfolio of 10 stocks continue to beat the market 6 out of 10 times from 2009 to 2019, generating a real CAGR of 18.9% compared to the SPY 12.3% real CAGR during this period. In 2018, when we had a “mini stock market correction”, Portfolio 3 generated real returns of 7.6% vs. SPY -6.4%.
So how did we formulate this list of 10-stocks?
We use a combination of proven recession-proof stocks and strong dividend growers.
Recession-proof stocks: Walmart, Ross Stores, Bristol-Myers Squibb, Autozone, and Dollar Tree
Dividend growers: Tractor Supply Company, WD-40 Company, Nike, Automatic Data Processing and Lowe’s Companies
Our definition of dividend growers is those counters which demonstrate a 5-years Dividend Growth Rate of more than 10%.
We find that a mixture of proven recession-proof counters and dividend growers provide the best combination to excel not just during a recession but also during bull markets.
A portfolio comprising of 100% dividend growers will excel strongly in a bull market but will likely take a similar beating during a market correction.
Hence, we believe that our current combination of these 10 stocks that make up Portfolio 3 (50% recession-proof counters and 50% dividend growers) might be the best play for a market that might be at the end of its bull-run. Even if we are wrong, these 10 stocks will likely still outperform the broader market.
However, given that we are selecting individual counters, there might be substantial unsystematic risks to be considered.
Is this the best stock combination for a portfolio? Of course not but the thesis behind it, I believe is sound. We don’t want to just concentrate a portfolio with 100% recession-proof stocks that might result in significant underperformance if the bull market continues. A 100% dividend-grower stocks might exhibit significant portfolio drawdown in a market correction which we will want to avoid as well.
A 50:50 combination of these 2 stock categories will provide the downside protection we want in a recession while also provide the upside lift from a strong equity market. Recall that in my article on the 7 Golden Rules of Dividend Investing, I highlighted that dividend growers are the strongest performers over the long-term. Hence, focusing on counters with a good record of accelerating dividend payments will increase one’s chance of generating stronger total returns and these are stocks we want to be exposed to in a strong bull market.
Conclusion
Portfolio 2 has demonstrated its resilience when it comes to economic recessions and periods of huge inflation. However, the downside is that it tends to significantly lag the index in a strong bull market. However, if one’s aim is for capital preservation against all economic climate, then Portfolio 2 should still be a major consideration as a retirement portfolio.
Portfolio 3, which consists of 10 individual equity counters, has shown to beat Portfolio 2 in almost all scenarios from 2000 onwards with the exception of the 2004-2007 period where inflation was running at 3-4%/annum. A solution could be replacing/adding a gold asset into the portfolio. That will likely improve portfolio performance in an inflationary environment but drag down portfolio returns in a bull market. We will probably be revising Portfolio 3 asset composition on a periodic basis to find our ideal stock portfolio composition.
Do Like Me on Facebook if you enjoy reading the various investment and personal finance articles at New Academy of Finance. I do post interesting articles on FB from time to time which might not be covered here in this website.
Join our Telegram broadcast: https://t.me/gemcomm
SEE OUR OTHER WRITE-UPS
- THE CONFUSING MATH BEHIND RETIREMENT SUM SCHEME AKA CPF LIFE PREDECESSOR
- DIVIDENDS ON STEROIDS: A LOW-RISK STRATEGY TO DOUBLE YOUR YIELD
- STASHAWAY SIMPLE. CAN YOU REALLY GENERATE 1.9% RETURN?
- WHY I AM STILL BUYING REITS EVEN WHEN THEY LOOK EXPENSIVE
- TOP 10 FOOD & BEVERAGE BRANDS. ARE THEY WORTHY RECESSION-PROOF STOCKS?
- TOP 10 HOTTEST STOCKS THAT SUPER-INVESTORS ARE BUYING
Disclosure: The accuracy of the material found in this article cannot be guaranteed. Past performance is not an assurance of future results. This article is not to be construed as a recommendation to Buy or Sell any shares or derivative products and is solely for reference only.




4 thoughts on “The Recession-Proof Portfolio that wins in ALL scenarios”
When you say 40% REITs and 20% gold, which REITs and gold in what form? Also are you including all the transaction costs for buying those and later turning them back into cash at the end of the period? Or are you just looking at the gold commodity price which might not reflect all the costs?
Basing it on the ETF. For REITs its SCHH ETF and Gold is GLD. Its a one time buy and hold strategy. The expense ratio I assume is negligible.
hi
could you recommend on how to construct portfolio 3 in Singapore’s context?
Hi Z,
Sorry for the late reply. If you are referring to using SG Stocks, there is just no way to go about doing that. Haha.