

Creating the ideal 4% withdrawal rule portfolio
I believe that some of you would be familiar with the 4% retirement rule. In a simple nutshell, this is the amount of money you might withdraw each year from the starting value of your portfolio of stock and bonds in retirement and not risk running out of money over a 30 years horizon.
For example, if you have $1,000,000 when you retire, the 4% rule would say that you could withdraw 4% of that amount each year, which is $40,000 for the first year.
In the second year, after adjusting for 3% inflation, we can withdraw $41,200. This can continue on for 30 years, adjusting for a 3% increment each year, and ultimately the portfolio will not run dry for 30 years.
For such a portfolio structure, most financial advisors would recommend a 60% allocation to equities and a 40% allocation to bonds. We showcase why that might not be the best structure and what our ideal portfolio structure actually looks like.
A brief history of the 4% rule
The history behind the 4% rule, also called the Bengen Rule, is created by William Bengen, a financial advisor, who published his research in October of 1994 in the Journal of Financial Planning under the title, “Determining Withdrawal Rates Using Historical Data”.
The original 4% rule used a retirement asset allocation of 50% stocks and 50% bonds. The S&P500 index was used for the stock allocation and intermediate-term government bonds were used for the bond allocation.
Based on Bengen’s data, the information showed that the highest withdrawal rate that had a balance over even the worst 30-year period was 4.15%. Therefore, the 4% withdrawal rate had a 100% success.
Is the 4% rule now relevant?
Kiplinger recently did a study in mid-2019, analyzing the 4% rule with real-world numbers.
Let’s assume it is 1989 now. They took $1 million and invest half into stocks and the other half into bonds using the Vanguard 500 Index Fund (VFINX) and the Dodge and Cox Income Fund (DODIX). They rebalance the portfolio every six months.
In the first year, they withdraw $40,000 and in the subsequent years, they adjust withdrawal by 3% each year to account for inflation.
So how did the portfolio perform over a 30 years horizon from 1989-2018? A $1 million portfolio turned into $5.9 million even after spending $1.9 million over the 30 years.
The study also broke down the performance based on each decade.
- 1989 – 1998: 14.09% per year
- 1999 – 2008: 2.59% per year
- 2009 – 2018: 9.45% per year
Note that things change a little if the order of each of the three decades were flipped and re-test.
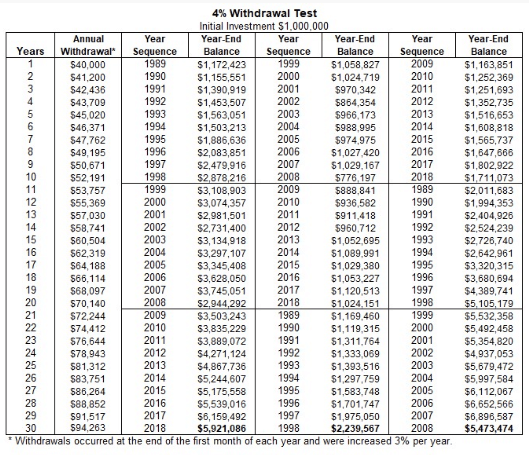
The worst performance was if the portfolio was initiated at the start of 1999 (middle column). That would have resulted in a portfolio ending value of $2.2 million. Still decent. So, based on a 4% withdrawal rate, the study made above shows that it is safe.
What would happen in a 5% withdrawal rate scenario?
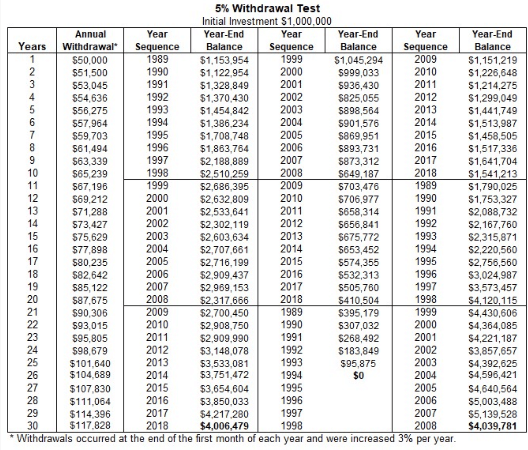
The middle scenario would have run out of funds before the end of the 30-years horizon.
The author of the original study, William Bengen, has modified his conclusion now and has increased his safe withdrawal rate to 4.5% when holding a more diversified portfolio.
A more localized context
Within the Singapore context, MoneyOwl has also done a study on the 4% rule, structuring a 60/40 portfolio based on the MSCI World Index which represents the global equities portion and the US Treasury which represents the bond exposure.
They used the Singapore historical inflation and a Total Expense Ratio of 1.2% to mirror the local retiree’s experience.
They created a 21 30-year rolling period where the model shows a 100% probability that one can withdraw 4% of their starting portfolio value, adjust it for inflation over the last 30 years, account for a 1.2% expense ratio and still come out tops.
They further stress-test their portfolio, using the following scenarios:
- Using 100% equities: 95% success rate
- Using 100% bonds: 86% success rate
- Using a 5% withdrawal rate on 60/40 equities-bond allocation: 81% success rate
- Using 2% TER on 60/40 equities-bond allocation: 90% success rate.
Their conclusion is that the ideal portfolio allocation and withdrawal rate is one with 1) 50-70% exposure to equities, 2) sticking to a 4% withdrawal percentage and go for 3) low-cost investing as higher fees of 2% will cause the model to fail 10% of the time.
This is all pretty useful information for a passive investor looking to structure his/her portfolio. It is also simple enough, modeling with just a 2-asset portfolio structure. The key is, of course, finding that magic retirement number in the first place.
How much income does one need for retirement? $30k, $40k or $50k a year?
I have previously written extensively on this matter in this article, detailing a step-by-step approach to find that magic retirement income figure one will need when he/she retires and how much investment is required after taking into account their pension asset.
However, this article is not about finding that “correct” retirement number but finding that “ideal” portfolio structure that perfects the 4% rule.
Structuring my own ideal 4% portfolio.
Nobody can say with certainty that a portfolio that consists of x% of equities and y% of bonds and z% of other alternative assets is the best.
One can, however, back-test such a portfolio to derive a reasonable conclusion on the effectiveness of structuring such a portfolio to achieve the ultimate goal of “Never running out of money”, even if I might not adhere to the 4% rule to the T in terms of annual withdrawal.
Personally, my ideal portfolio structure will be one that consists of REITs, with a pretty heavy weightage as well. I have written a couple of in-depth articles (Article 1, Article 2) on why REITs should be an asset class in one’s portfolio.
It will be nice to have some gold component as well to hedge against inflation.
So, my own ideal portfolio could consist of 20% Equities, 20% Bonds, 40% REITs, and 20% Gold. How would such a portfolio perform for example and can it achieve the ultimate goal of meeting the 4% withdrawal rule 100% of the time, based on historical data?
I used this website called portfoliocharts.com to structure this pseudo portfolio to look at the potential returns based on historical data stretching all the way back to 1970.
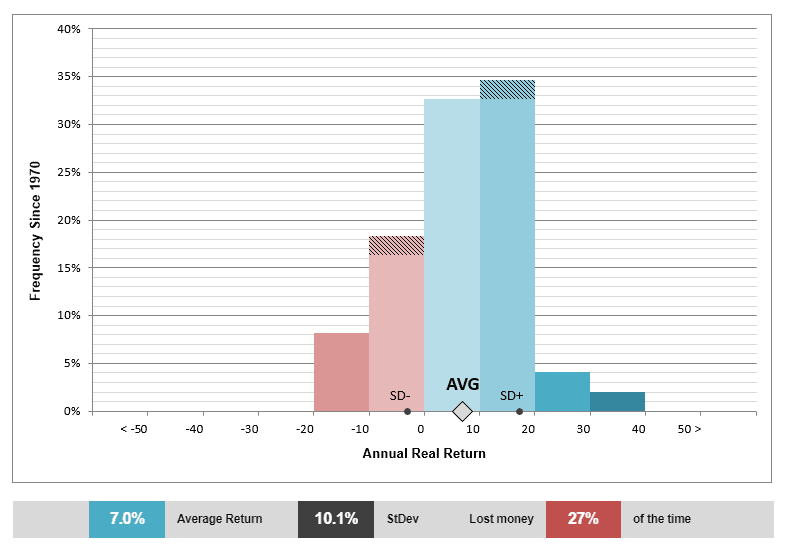
My ideal portfolio which consists of the above structure achieves an average annualized real return of 7% since 1970.
More importantly, this is a portfolio structure that allows me to have a 6.4% withdrawal rate without risking my portfolio running out of money over the course of 30 years. Yes, 6.4% vs. the traditional 4%. If my withdrawal period extends to 40 years, that is still an attractive 6% withdrawal rate.
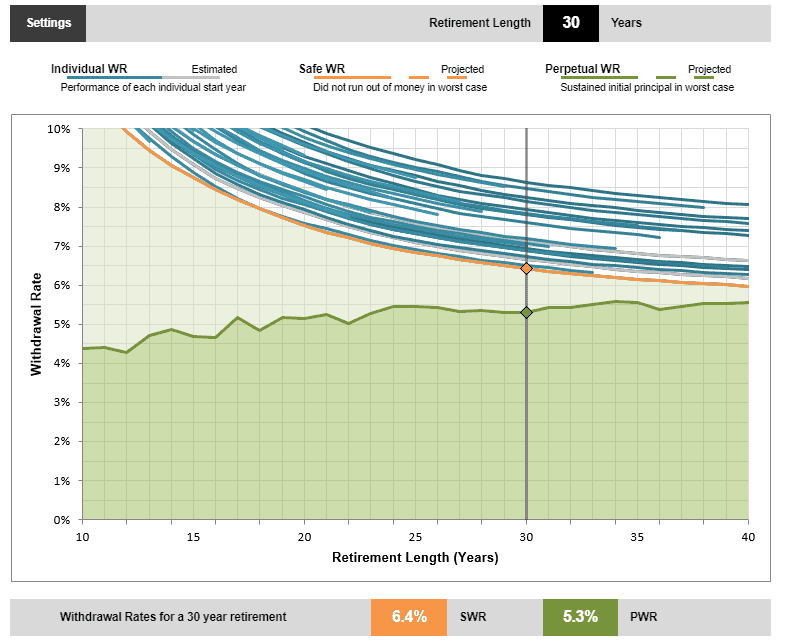
It also has a 5.3% perpetual withdrawal rate, which is the rate that is able to sustain the initial principal amount even in a worst-case scenario.
This sounds like a dream portfolio structure, one that is self-sustaining not just based on the standard 4% rule but at a much higher threshold of 6.4% over a 30-years duration.
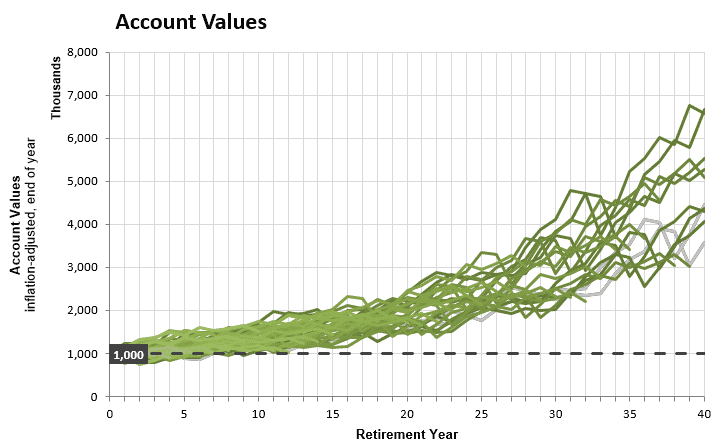
Using the standard 4% rule, this portfolio structure will have a 100% success rate with an average remaining value of $3m by the end of 30-years which is seemingly inferior to the test done by Kiplinger for their best performing portfolio. This could be due to a number of differences:
1) The best performing Kiplinger study started in 1989 as the first year, ending in 2018, while this example has a number of portfolios that started in 1970. Recall that the US, in particular, witnessed huge stagflation in the 1970s which might have depressed some of the portfolio performances in the early years.
2) The portfolio structure of a heavy equity weightage in the Kiplinger study resulted in out-sized annualized returns in 1989-1998.
3) The different selection of equity and bond funds.
4) The Kiplinger study was rebalanced every 6 months.
Doing a more comparative study
I tried to do a similar comparison by using a portfolio structure that has 60% weightage in a US total return equity fund and a 40% weightage in long term Treasury as available in portfoliocharts.com website.
This portfolio generated 12.1% annualized returns from 1989-1998, 1.2% annualized return from 1999-2008 and 8.2% annualized return from 2009-2018 which shows a similar albeit inferior trend compared to the Kiplinger study.
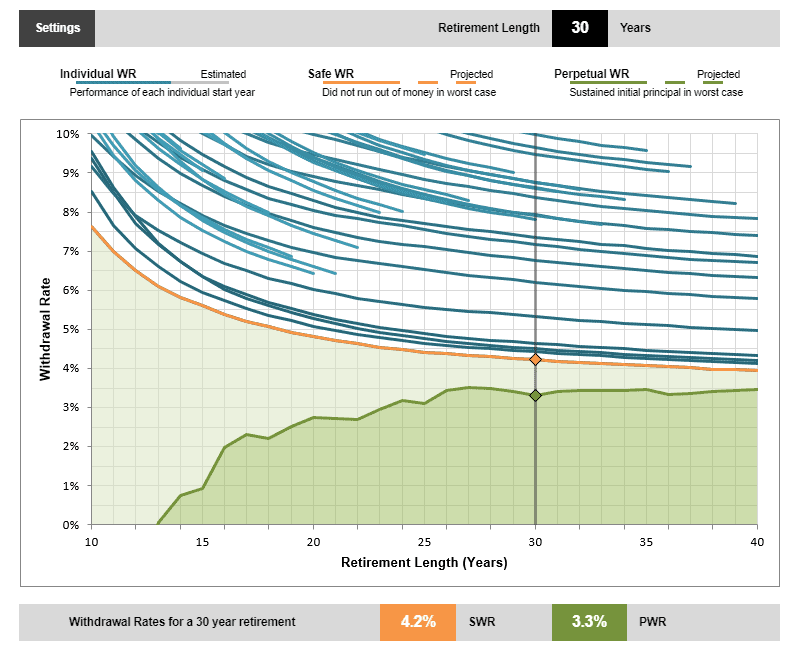
However, this portfolio would only have a safe withdrawal rate of 4.2% and a perpetual withdrawal rate of 3.3%, 50% below my ideal portfolio structure.
If this portfolio was created in 1970, it would have resulted in an annualized return of only 6.3% since 1970 compared to our ideal portfolio structure of 7% CAGR over the same time frame.
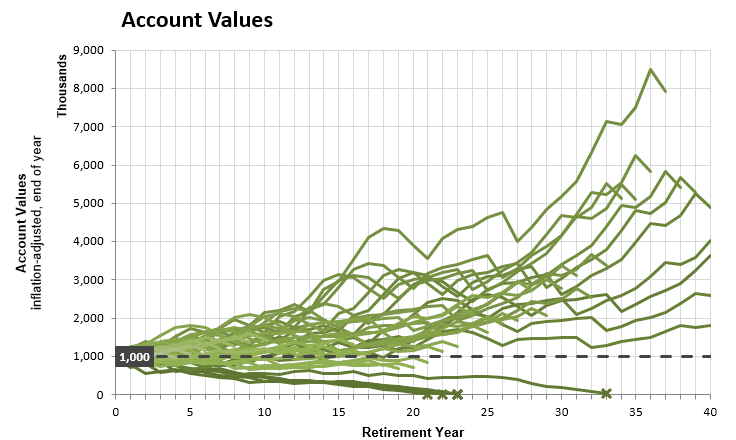
More critically, such a portfolio would also not have a 100% success rate, with the portfolio running out of money in a number of scenarios, particularly if the portfolio was structured in the early 1970s.
What we wish to achieve is not a portfolio that generates the greatest end-value at the end of the x-period but one that is robust enough to stand-up against any economic environment while still ensuring that funds in the account are not being depleted.
Again, a note of caution that historical performances might not be representative of future performances.
Conclusion
This is a simple exercise using some historical data that showcases that the 60:40 equity to bonds portfolio allocation structured for a 4% withdrawal rate might not be the ideal portfolio allocation structure.
Using data from portfoliocharts.com, I have demonstrated that a portfolio comprising of 20% US equity, 20% long-term bonds, 40% REITs and 20% Gold might be a more ideal portfolio structure to obtain a greater safety net when it comes to the 4% withdrawal rule for retirement.
What is your ideal portfolio structure?
Do Like Me on Facebook if you enjoy reading the various investment and personal finance articles at New Academy of Finance. I do post interesting articles on FB from time to time which might not be covered here in this website.
Join our Telegram broadcast: https://t.me/gemcomm
SEE OUR OTHER WRITE-UPS
- THE CONFUSING MATH BEHIND RETIREMENT SUM SCHEME AKA CPF LIFE PREDECESSOR
- DIVIDENDS ON STEROIDS: A LOW-RISK STRATEGY TO DOUBLE YOUR YIELD
- STASHAWAY SIMPLE. CAN YOU REALLY GENERATE 1.9% RETURN?
- WHY I AM STILL BUYING REITS EVEN WHEN THEY LOOK EXPENSIVE
- TOP 10 FOOD & BEVERAGE BRANDS. ARE THEY WORTHY RECESSION-PROOF STOCKS?
- TOP 10 HOTTEST STOCKS THAT SUPER-INVESTORS ARE BUYING
Disclosure: The accuracy of the material found in this article cannot be guaranteed. Past performance is not an assurance of future results. This article is not to be construed as a recommendation to Buy or Sell any shares or derivative products and is solely for reference only.


5 thoughts on “Why 60:40 equity/bond allocation isn’t the ideal structure for a 4% withdrawal rule portfolio”
Are you concerned that 40% of the portfolio are in an instrument that wasn’t created until 1960? That only gives you 29 rolling thirty year periods versus the sixty periods available for stocks and bonds?
Hi Steveark,
I believe you are referring to REITs as an asset class that was created only in 1960? Sorry, I am not sure what you meant by 29 rolling 30-year periods.
My thinking is, instead of having 60% weighting in stocks, I choose to over-weight REITs which have shown to be an outperformer in most part of the economic cycle vs. stocks. But the correlation is still positive albeit not close to 1. The 20% bond which has a negative correlation with stocks and REITs will act as a hedge against recession while the 20% allocation to gold will hedge against inflation.
If you go to the website, portfoliocharts.com, and play around with the portfolio structure, you can see their rolling performances. An equity heavy portfolio structure will suffer significantly in the 1970s while that of my ideal structure is relatively resilient. You will not have outsize gains in the 1990s period unlike the equity heavy portfolio but neither will you experience significant downside drawdown.
Overall, while REITs history is shorter compared to stocks and bonds, I believe their fundamentals, hinging on real physical assets retaining value in a land-scarce world remain sound.
Actually most asset allocations will do well in the next few decades, as long as bonds don’t take up more than 20%-25% of the overall portfolio. E.g. classic Permanent Portfolio.
Asset allocations with large stocks weightage is the best for legacy purposes i.e. leaving behind a big inheritance or endowment fund. The problem is always negative sequence of returns risk especially in the first 5 years of retirement, which can be mitigated by using bond tent or cash shield.
Hey sinkie,
Yes, I agree with you that asset allocations with large stock weighting have a higher probability of a “legacy bonus”. However, despite my “want” to leave a legacy to the next generation, the “need” is still for self-preservation, if I may put it crudely. Haha.
A large equity portion inevitably results in higher volatility and like you mention incurring negative sequence of return risk.
This is evident from my example where a 60:40 equity: bond portfolio structure if created in the early 1970s, runs the risk of depletion before the 30 years are up.
I am not sure about a strategy of having higher bond weighting as a mitigating effect to provide the additional income in today’s low-interest-rate environment. That is where maybe the REITs asset might come into play?