
Dollar-Cost Average + OCBC BCIP
This article will be broken down into two parts. I will first write about my decision to carry out dollar-cost averaging followed by my experience with OCBC BCIP (blue-chip investment plan).
What is Dollar-Cost Averaging?
Dollar-Cost Averaging (DCA) is a passive investment strategy that advocates periodic investment on a particular share regardless of price movements. As the market is highly volatile, you might easily run the risk of getting caught investing a lump sum into the market at the wrong time. Can you imagine seeing years of savings go to waste just because of a bad investment decision? I certainly can’t!
So how can we avoid this risk? Instead of a lump sum investment, DCA believes in spreading out one’s capital into smaller tranches. By doing so, you can minimize your odds of getting caught by the market while building a sizeable portfolio. Too good to be true? Carry on reading and we’ll show you why.
Why Dollar Cost Average?
“Time in the market beats timing the market” has always been a quote that resonates with me ever since I started my investment journey. According to a report released in 2020, a staggering 90% of actively managed funds failed to beat the market! 90%! Like many others that tried to time the market, I ended up losing more money timing my entries than actually being in it. After countless hours of researching on Dollar Cost Averaging, here are my top 2 reasons to DCA and my concise thoughts regarding it.
Volatility
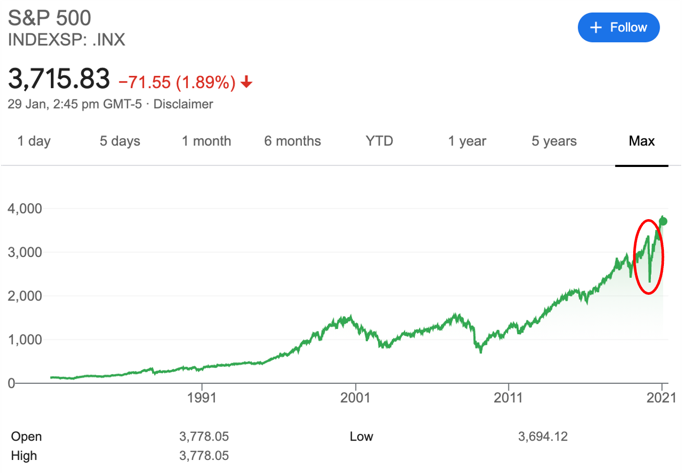
Historically, the market tends to move in an upward direction as seen from the charts below. With interest rates at historic lows and the FED’s commitment to keeping it as such, it’ll be safe to say that equities will likely remain as an attractive investment. Looking at the S&P500 since its inception, the recent market dip due to Covid-19 is negligible compared to its growth!
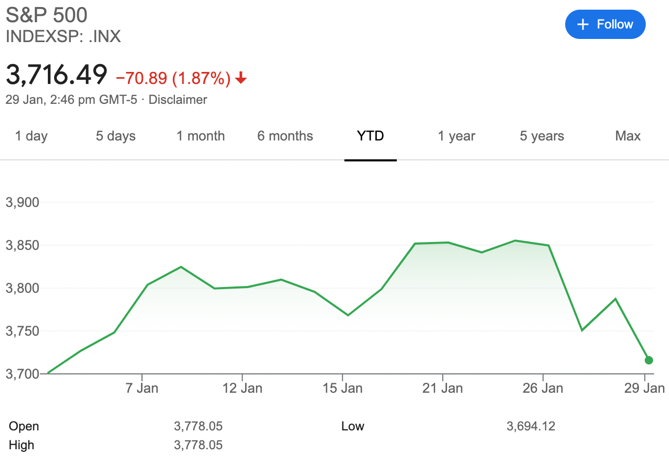
However, a closer look into the index will show its true volatility. Just last year, the S&P500 lost 33% of its value over just several weeks! To put it into perspective, a lump sum investment into the market just before the crash would’ve cut your wealth by a third! On the other hand, if you were to split your investments into tranches via Dollar Cost Averaging, this is something that you can easily avoid! (And potentially saving you months of sleepless nights!)
But since the market is always trending upwards, you might wonder why can’t you just hold your investments? We’ll cover it under influence of emotions below!
Additional Reading: How to become a millionaire even with the worst market timing
Influence of Emotions
Some may argue that mastering the psychology behind trading is key to success in the market. It’s no secret that emotions have been touted as one of the main drivers of poor investment decisions. But why so? Humans tend to be susceptible to fear and greed which is the perfect combination for disaster! Here are some common mistakes people make:
- Buying high and selling low may sound ridiculous but at times of “FOMO” and pure market euphoria, herd mentality can cause one to chase the market and end up entering at its peak. When a correction begins, fear seeps into the market and investors start dumping shares at a loss. When the valuation is at its all-time high, you’re essentially playing musical chairs in the market trying not to be the last one left! Are the high stakes worth it?
- Falling in love with a company is another common mistake made by investors. Being too emotionally attached to a company can result in you ignoring potential warning signs! Industries are constantly going through transformations and it will ultimately leave some firms behind. The attachment can leave you with a falling knife or even averaging down to a company that may never recover in their price or prospects.
How do we avoid volatility and the influence of emotions? – Automation!
After reading about the various risks of the markets, you might wonder how can we avoid them? The answer is automation! Do you know that 80% of the trades in US markets are done via algorithms?
It’s no secret that the risks mentioned above have been regarded as one of the key drivers of poor investment decisions. If the big players like Bridgewater, the largest hedge fund in the world, are doing all their trades via computers then should we still carry out active investments?
Putting together the risk of volatility and emotions, ultimately made my decision to carry out dollar-cost averaging! The risk of losing 33% of my capital due to market crashes will keep me awake at night. Moreover, dollar cost averaging allows you to build a sizeable portfolio over time with minimal risk. Being able to sleep soundly while letting my money work for me sure sounds like a win-win situation!
Additional Reading: Are you still waiting for the stock market to crash in 2022?
Final thoughts on Dollar-Cost Averaging
I believe that dollar-cost averaging is not only ideal for working adults but students with smaller capital as well. As students do not have much income, this strategy allows them to invest as little as $100 a month into the market to build their portfolio.
Never underestimate the power of compounding! If you were to start your DCA plan at 18 with a monthly investment of $100, you would’ve amassed a portfolio of $14,400 by age 30. However, you might be wondering “Doesn’t it cost an average of $10 per transaction which would eat into my investments?” That’s where services offered by financial players come into play!
Additional Reading: A better alternative to Dollar Cost Averaging?
OCBC BCIP
While searching for a suitable DCA product in the market, I’ve decided to go ahead with OCBC Blue Chip Investment Plan. Here are the reasons why:
Product Accessibility
I was looking for an initial investment plan that provides access to blue-chip counters in the Singapore Market. OCBC Blue Chip Investment Plan fits perfectly with my needs. Apart from allowing a fixed investment into exchange traded funds (ETFs), it gives investors access to 19 different counters in the market.
The variety of choices range from the likes of DBS, OCBC, UOB to REITs and even ETFs! Furthermore, it includes OCBC’s new Hang Seng Tech ETF that tracks the 30 largest tech companies in Hong Kong.
Fees and Charges
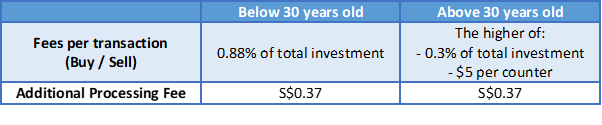
The BCIP account charges are relatively lower than other providers that give access to blue-chip counters in Singapore. As seen in the table below, investors under the age of 30 years old enjoy a fee of only 0.88% per transaction.
After testing out the investment plan, it costs me about an average of $1 to $2 per month which is highly reasonable!
Steps to create an OCBC BCIP Account
Step 1: Open an OCBC account if you haven’t
To sign up for the investment plan, you’ll have to first open an OCBC deposit account if you haven’t. For investors below 30 years old, a FRANK account is needed to enjoy the lower fees.
Step 2: Apply for OCBC Blue Chip Investment Plan
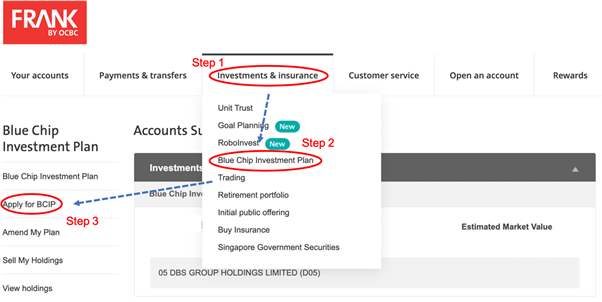
Once you have your OCBC deposit account, follow the 3 steps shown in the picture above to set up your own BCIP through OCBC online banking.
Investment & Insurance à Blue Chip Investment Plan à Apply for BCIP account.
Step 3: Selection of investment counter and amount
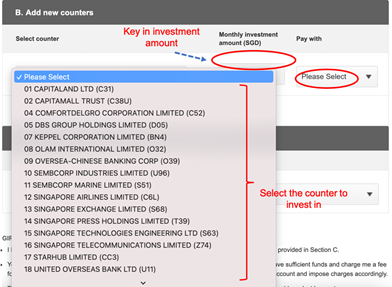
From this page, you will be able to select your desired counter to invest in as well as the amount allocated per month. Upon completing this form, you should be able to get your confirmation within a week!
A final tip for OCBC BCIP (Blue Chip Investment Plan)
Every month, OCBC will send you a physical letter to inform you of your investment. To my knowledge, the only way for you to know your monthly cost per share will be from these letters. Therefore, it is highly encouraged to store them aside and track your monthly investment through Excel. This will allow you to know your average cost per share and performance throughout your DCA journey.
Hope that you’ve picked up something new from this article and do let me know if you’d be interested in an excel template to track your DCA investments! Happy investing!
Do Like Me on Facebook if you enjoy reading the various investment and personal finance articles at New Academy of Finance. I do post interesting articles on FB from time to time which might not be covered here in this website.
Join our Telegram broadcast: https://t.me/gemcomm
SEE OUR OTHER WRITE-UPS
- DIVIDEND YIELD THEORY – THE UNDERAPPRECIATED VALUATION TOOL
- TOP 5 ANALYSTS OF THE DECADE AND THEIR CURRENT FAVORITE STOCKS
- IS DRINKING LATTE REALLY COSTING YOU $1 MILLION AND THE CHANCE TO RETIRE WELL?
- DIMENSIONAL FUNDS: ARE THEY WORTH THEIR WEIGHT IN GOLD?
- THE CONFUSING MATH BEHIND RETIREMENT SUM SCHEME AKA CPF LIFE PREDECESSOR
- DIVIDENDS ON STEROIDS: A LOW-RISK STRATEGY TO DOUBLE YOUR YIELD
Disclosure: The accuracy of the material found in this article cannot be guaranteed. Past performance is not an assurance of future results. This article is not to be construed as a recommendation to Buy or Sell any shares or derivative products and is solely for reference only.


