

Common technical analysis indicators
Have you ever experience going through hours of market research and valuation but find your efforts going to waste due to bad market timing? This is where Technical Analysis (TA) comes in to guide your decision-making!
Technical analysis is another school of market analysis used by investors, involving the study of market data such as price and volume. Using past performances and charts, Technical analysis seeks to predict future market behaviour and action. Ultimately Technical analysis supplements any research you’ve done as it provides you with an entry and exit to counters.
This article serves as a beginner guide to common technical analysis indicators which you can use and apply for your investments! We will focus more on the application and less on the mathematical derivation of these indicators.
Technical Analysis Indicator #1: Support and Resistance
Purpose: Both support and resistance lines are typically drawn using trendlines. They can either be horizontal or angled to represent past reversals of the market price. By identifying these lines, it allows investors to time entries or exits of positions.
Support levels
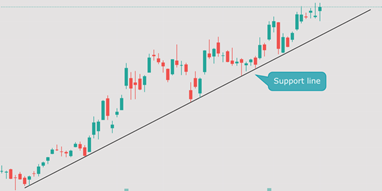
The support line serves as a floor by preventing prices from being pushed further downwards. When prices fall towards the support line, the counter will typically see buyers stepping in to buy the “dip”. With the reactionary rebound, investors can look to set their buy orders near the support line to increase their odds of a winning trade.
To illustrate a strong support level, below is a screenshot of a counter that rebounded from support more than 6 times! In other words, the counter respected the support line and made a series of higher lows. Unless the counter breaks below its support, it is generally showing a bullish sign.
Resistance levels
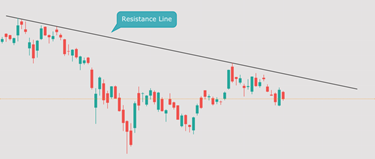
Conversely, the resistance line serves as a ceiling by preventing prices from being pushed further upwards. When the prices rise towards the resistance line, the counter will typically see sellers coming in to take profits. With the reactionary rebound, investors can look to set their sell orders near the support line to increase their odds of a winning trade.
To illustrate a strong resistance line, below is a screenshot of Tesla which has been retracting from the resistance line four times! In other words, the counter respected the resistance line and made series of higher lows. Unless Tesla breaks above its resistance line, it is generally bearish for the company.
Putting both lines together
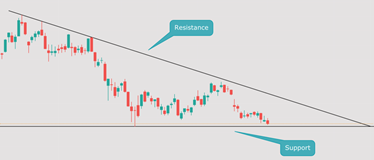
If you were to put both lines together, you can typically find triangular patterns as shown below. There are three key variations of these triangles:
- Symmetrical
- Ascending
- Descending
When these triangles occur, the price of the company is typically kept between both support and resistance. In this case, the picture below shows a descending triangle. With a series of lower highs, this price action is typically bearish as there is a higher chance of the price breaking below support!
Are these triangles always accurate?
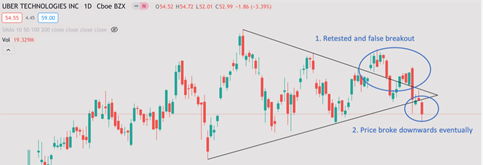
The trendlines serve as an indicator for investors while maintaining one’s positions. However, as the market is highly dynamic, these indicators may not always play out as they should! An example would be the recent price action of Uber as shown below.
With reference to the picture, the larger circle showed a series of breakout and retest of the resistance line and eventually Uber broke below the support. However, investors can look at the trendlines to set various orders such as buy, sell, or even stop-loss orders. Ultimately, it will give your investments a lower risk and higher returns.
Technical Analysis Indicator #2: Relative Strength Index (RSI)
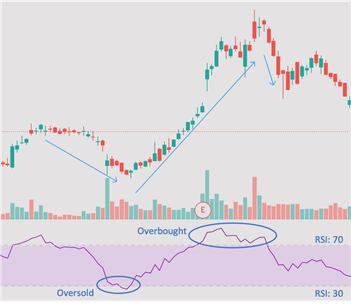
Purpose: RSI is an oscillator with a reading from 0 to 100. It measures the significance of recent price changes to evaluate if a particular counter is oversold or overbought. In general, shares that are overbought might move into an overvalued territory and are likely due a pullback.
This is how you can interpret the RSI readings of counters:
· RSI of 70 and above refers to an overbought territory
· RSI of 30 and below refers to an oversold territory
The picture below shows the price action of Twitter (NYSE: TWTR) with reference to the RSI values. As the counter was approaching an oversold territory early this year, it was an indication that the company might be undervalued and due a rebound. As it turns out, the counter moved from the lows of $44.41 to $80.70 for an 81% move upwards. However, it was also evident that the shares were in overbought territory and TWTR has pulled back ever since.
Hence, RSI can supplement the decision-making of investors as it provides an indication of a share being oversold or undersold. For example, investors can consider selling shares when it approaches an oversold territory as it is likely due for a pullback!
Technical Analysis Indicator #3: Moving Averages (MA)
Purpose: As the market fluctuates daily, moving averages are used to smooth out price trends and understand the general direction of counters. There are many variations to the timeframes of MA such as 10-day, 21-day, or even 200-day. These are several ways to use this indicator:
· MA can serve as a support or resistance for counters
· Various pairings can be seen as a bullish or bearish indicator
Derivation of MAs
MAs can be calculated as Simple Moving Averages (SMA) or Exponential Moving Averages (EMA). Although both runs on the same concept, the calculation slightly differs.
MAs refer to the average of past prices and this is how the numbers are derived. Let’s say we’re looking to calculate the 8-day moving average and the market prices are as such.
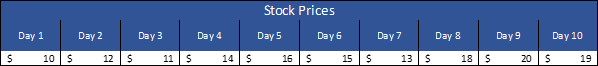
To get the 8-day SMA, you will have to sum the prices from Day 3 to Day 10 and divide it by 8! In this case, you’ll get $15.75. You can see that MAs are updated daily which gives investors the latest and actionable price trend.
As for the calculation of EMA, it runs on a similar concept with a smoothing factor. Without being nerdy with the mathematical derivation of the numbers, EMA provides a heavier weightage to recent prices.
MA as Support or Resistance
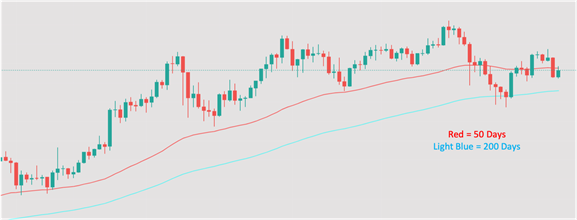
As mentioned previously, MAs can sometimes serve as a support or resistance to a counter’s price action. Below is the chart for Bitcoin against USD. Since October last year, the 50-day EMA served as a support level for Bitcoin as it has been holding above the red line. Although Cryptocurrencies saw a selloff recently, Bitcoin was able to find support at its 200-day EMA and is working towards reclaiming its 50-day EMA.
Hence, investors can consider using these indicators to time your entries or exits to increase your odds of a winning trade!
Pairings to provide bullish or bearish indicators
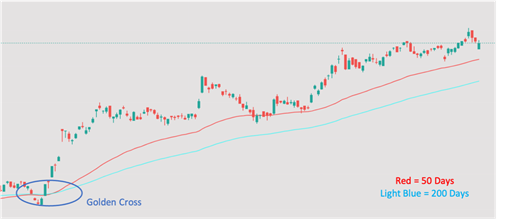
There are certain pairings in the market that can indicate a strong market movement. Have you come across people mentioning “Golden Cross” or “Death Cross”? This occurs when the 50-day and 200-day cross another in the charts.
Golden Cross: 50-day MA crosses and moves ABOVE the 200-day MA
Death Cross: 50-day MA crosses and move BELOW the 200-day MA
Let’s see some examples found in the local stock market! We’ll analyse DBS for this segment.
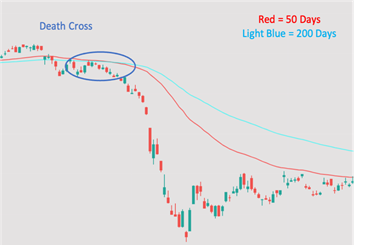
Death Cross
Below was the price action for DBS just when Covid-19 struck the market. In March last year, a death cross occurred as the 50-day EMA crossed and moved below the 200-day EMA. Imagine if you knew about this indicator and exited your positions once the cross occurred. You would’ve avoided the bloodbath in March!
Golden Cross
In November last year, the Singapore market started an uptrend which saw the 50-day EMA crossing back above the 200-day EMA. It shows a golden cross and DBS rose by 48% since then!
Apart from the 50-day and 200-day pairing, other pairings that you can look at would be the 8-day and 21-day pairing. Both pairings run on the same concept that the market is showing strength when the shorter time frame MA crosses above the longer one.
Technical Analysis Indicator #3: Moving Average Convergence Divergence (MACD)
Purpose: MACD is a trend-following momentum indicator that shows the relationship between two EMAs of a counter. MACD is used to identify bullish or bearish momentum to find ideal entries and exits from positions.
There are two key components of MACD. Knowing these two key components will be important to understand the components of MACD:
- MACD Line = 12-day EMA – 26-day EMA
- Signal Line = 9-day EMA
MACD Histogram
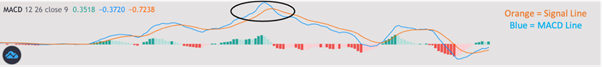
When the charts compute both the MACD and Signal line, you will be able to see the MACD Histogram as shown below. The size of the histogram is dependent on the space between both lines. The larger the deviation, the higher the bars and momentum of the counters.
Below is an example of the MACD Histogram. In the circled portion, the MACD is above the Signal Line which is a sign of positive momentum. The larger the deviation between the lines, the higher the MACD Histograms.
When the MACD crosses the Signal line, it is a sign of strength which can be a possible entry for investors!
Application of MACD
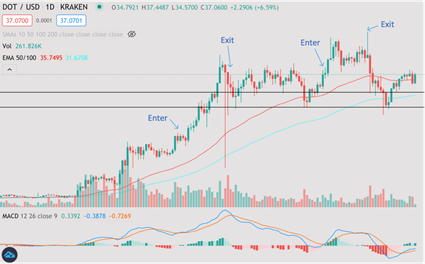
To illustrate the above, this is a crypto pair traded in the market. Counters will typically show strength when the MACD Line crosses the signal line. Therefore, you can look to time their entries based on such indications.
It is also to note that this is not a sure win entry and investors should still carry out due diligence before making decisions.
Conclusion
I personally believe that Technical Analysis and the usage of technical analysis indicators is not a sure-win strategy but it can be useful as a supplementary tool to supplement your trading/investing journey.
As long as the company is financially sound, technical analysis can help long-term investors to better “time” their entries in core positions to improve their return potential. For traders, mastering the art of technical analysis and the usage of various technical analysis indicators is crucial for long-term success as a trader.

The Systematic Trader
Rated as the best investing platform by Seedly Reviews, The Systematic Trader course uses the proprietary trading platform TradersGPS to take the emotion out of your trading process
Alternatively, one can also rely on a proven technical analysis platform such as TradersGPS technical trading platform to simplify the decision-making process (when to enter/exit a position).
Do Like Me on Facebook if you enjoy reading the various investment and personal finance articles at New Academy of Finance. I do post interesting articles on FB from time to time which might not be covered here in this website.
Join our Instagram channel for more tidbits on all things finance!
SEE OUR OTHER WRITE-UPS
- Dollar Cost Averaging vs Lump Sum Investing. Which is more suitable for you?
- Stocks vs Bonds vs ETFs vs Mutual Funds: A Beginner Primer
- 4 Most Favoured Types Of Investment In Singapore For Inflation-beating Returns
- Cash Secured Put: Generating passive income the right way
- 4 Steps to understanding your Investment Time Horizon
- Beginners Guide to CryptoCurrencies and how to get started in 2021?
Disclosure: The accuracy of the material found in this article cannot be guaranteed. Past performance is not an assurance of future results. This article is not to be construed as a recommendation to Buy or Sell any shares or derivative products and is solely for reference only.


1 thought on “Technical Analysis For Beginners: Technical Analysis Indicators You Must Know”
Hi admin https://newacademyoffinance.com/ ,
I hope you are fine and enjoying good health. I was reading and researching home improvement in this digital world and I found you (luckily).
And I know how hard it is to write good quality content. However, I found your website ” https://newacademyoffinance.com/ ” suitable for my articles. I need to contribute to your website, Can I have the guidelines and the criteria for getting this done?
All the content provided will be original, of high quality, and without any plagiarism.
Looking forward to a positive response,
Thanks.
Best Regards