
While I don’t recommend trying to time stock purchases with a crystal ball in front of you, especially during a bear market potentially as severe as the one we are currently facing, I will provide some reference point as to when might be the IDEAL time to PICK a bottom and start investing more aggressively in a recession.
This is not going to be from my GUT but instead using historical statistics to time entry. YES, I know that historical performance is never representative of the future trajectory of the stock market, especially one that is seemingly unprecedented as the current one.
Then again, having some maths behind you beats randomly pulling out some FORECAST based on your gut.
Before I disclose “my formula” on when to buy stocks in a recession, the question I like to ask is: Are we already in a recession? Seems to be a no-brainer question especially with more than half the world being on lockdown, right?
What defines a RECESSION?
A recession is a significant decline in economic activity, lasting more than a few months. There is a drop in the following 5 economic indicators:
- Real Gross domestic product (GDP)
- Income
- Employment
- Manufacturing
- Retail Sales
The current situation seems to tick all the boxes in this category.
A “simpler” definition for a recession is when the GDP growth rate is negative for two consecutive quarters or more. While it might seem simple, there might be some confusion. Should we be measuring GDP growth on a YoY basis (ie compare 1Q20 to 1Q19) or should we be measuring it based on QoQ (ie comparing 1Q20 to 4Q19).
The latter comparing on a QoQ basis is often being termed as a “Technical Recession” within the Singapore context (If you type technical recession in Google, most of the results are related to Singapore).
How does the US calculate GDP growth?
In the US, the Bureau of Economic Analysis uses real GDP to measure the US GDP growth rate. Real GDP takes out the effect of inflation. GDP is calculated every quarter but is being annualized. The aim of annualizing is to remove the effect of seasons. If the BEA did not do this, there will always be a spike in the 4Q growth rate due to the holiday seasons.
The BEA provides a formula for calculating the US GDP growth rate which I will not detail much in this article.
Is the US already in a recession?
Depending on which article you read, some might say that the US is already in a recession while others such as this Bloomberg Tracker (last updated March 11) which pegs the probability at “only” 53%, still the highest level since GFC. However, that tracker was done before the jobless claims blew up over the past 2 weeks, now more than 10m, so I reckon that probability ratio will probably be inched up significantly in the next update.
Given the COVID-19 scenario that we are facing, whether we choose to look at GDP growth from a YoY or QoQ basis, it is difficult to argue against the fact that US GDP growth will be negative in 1Q20 and 2Q20.
Even if the COVID-19 issue miraculously resolves itself today, the uncertainty surrounding a possible relapse will result in nations all over the world engaging a protectionist stance that will stymie the global economic recovery process.
My best guess, if I am to look into my crystal ball is that the peak of the COVID-19 issue for developed nations such as US, Italy and Spain will probably be sometime in late-April to early-May by which the focus will then turn to developing nations such as India and Indonesia where cases are just beginning to ramp up.
Developed nations will continue to shut off their borders to foreigners for fear of a relapse, just like what China is currently doing. The V-shape recovery which many people are hoping for is probably not going to happen in such a scenario.
How bad is this recession going to be?
I don’t have an answer, but looking at how the global unemployment rates are trending due to the lockdowns which are being extended much longer than most politicians would have hope for, my guess again is that it is not a “mild recession” but a relatively severe one.
Is it going to be as bad as the Great Depression of the 1930s? Possibly, if the COVID-19 issue in developed nations is not being resolved over the next 2 quarters.
So I think I have made the case that a global recession is likely unavoidable in the current context. If a recession is happening, based on historical data, how would the stock market react? This brings us to the gist of this article.
How would the stock market react to a recession?
We don’t need the National Bureau of Economic Research (NBER) to formally declare that the US is in a recession to know that we are in one.
The stock market would have indicated that.
So I compiled a list of recessions (13 of them) since the Great Depression and the stock market reaction to it. There were some mild recessions like the 1960-61 recession where the maximum stock market decline from peak to trough was only c.12% while the most severe one was undoubtedly the Great Depression itself with the stock market cratering by 86% from peak to trough.

On average, the stock market would have peaked 6 months before the recession begins.
However, if we were to compare the latest 5 recessions, that figure shrinks to just 3 months. So if the peak of the stock market happens on 19 Feb 2020, we should expect the current recession to start sometime in mid-late May. Former Federal vice-chairman Alan Blinder says that the recession has already started in March 2020.
More interestingly, we would like to know when will the market trough. That is the gist of this article right? To know when to buy stocks in this recession.
We know that the stock market would have recovered before the end of the recession. On average, the stock market would have bottomed 4-5 months before the end of the recession. The key exception was in the early 2000s recession where the stock market continues to collapse, even after the end of the recession, due to the tech bubble bursting.
However, by the time we know that the recession has ended, it is TOO LATE to pick the bottom. It is like looking at the rear mirror. Yes, it is never too late to start investing but if the aim is to get the “best bang on our buck” then we need another measurement.
Based on the fact that we know when the recession has started, we can use that fact to calculate when the stock market trough after the recession starts.
The longest time was during the Great Depression where it took the market close to 3 years from the onset of the recession to finally find a bottom. The fastest was the 1953 recession which took just 1 month from the start of the recession to the trough in the market.
On average, it took close to 10 months from the start of the recession to the trough in the stock market. This is also a similar duration if I was to take the average of the last 5 latest recessions.
So, if the recession had already started in March 2020, the historical data seems to suggest that the market will only find a bottom sometime in Jan 2021.
This is purely based on empirical data. Of course, there could be many things that might render this forecast obsolete or irrelevant. The fact that the Fed has run out of bullets to further lower interest rates, or the greatest and quickest money printing exercise to be adopted by the world, etc could change how the stock market reacts in today’s context relative to their historical behavior in a recession.
When to buy stocks? How to better TIME a market entry in a recession
Without engaging the use of technical indicators, I might suggest 3 ways of TIMING the market.
1.Using 10 months from the start of the recession as a reference point
This is based on the historical data that we have compiled, using the average time which a market finds the bottom from the onset of the recession. That could mean a bottom in Jan 2021.
For a pretty severe recession such as the Great Depression, the 1937-38 recession, the 1969-70 recession, the 1973-75 recession, the early 2000s recession and the Great Recession of 2008, the average time the market takes to find a bottom from the start of the recession is approx. 1.3 years.
That could mean that the stock market might only bottom sometime in May-June 2021.
2.Based on the maximum peak to current market decline
If we believe that this is going to be a relatively severe recession and not one that looks like a V-shape, then we should expect the stock market to take a severe beating in terms of its decline from peak to trough.
The average peak to trough for the past recessions were approx. -33%. For the severe recessions that we highlighted above, the average peak to trough drawdown is -54%.
Currently, the S&P500 peak to the current drawdown is approx. -25% so the rout might just be 50% completed.
One could start to tune up his/her aggressiveness if and when the market hits a drawdown of 50%.
However, that does not mean going ALL-IN as this recession might well turn out to be long-drawn depression. We just don’t know, YET.
Unless we are headed into a Depression-like global economic slowdown, in which the stock market could potentially collapse 80% from peak to trough, the 50% mark might be a good starting point to time one’s entry.
3.When the NBER calls for the start of a recession
When the NBER calls for the start of a recession, that might be the time to start buying! This seems counterintuitive but notes that it takes the NBER organization a long while to collate data and finally confirm the start of a recession. By that time, the bulk of the recession is likely over.
For example, the great recession which started in Dec 2007 was “officialized” by NBER in Dec 2008, one year after the start. The market subsequently trough in Mar 2009.
Before that in the 1981-82 recession which started in July 1981, the NBER officially declared the start on Jan 1982. The stock market trough in July 1982.
Negative earnings revision still to come
I have provided my own “formula” as to when to buy stocks in a recession. While I advocate that a newbie should just cautiously dollar cost average into this downcycle, getting the timing right might make a substantial difference in terms of one’s long-term return.
Again, this is just for reference, using historical data as a basis. I am not a psychic and I don’t advocate to be one.
There are of course other reference points such as the trough in S&P 500 earnings. As seen from the chart below from multpl, the trailing S&P500 PER multiple is now down to 19x from the recent peak of 24x. The mean is 15.8x. Do note that this is based on the “last 12-months, as reported” earnings.
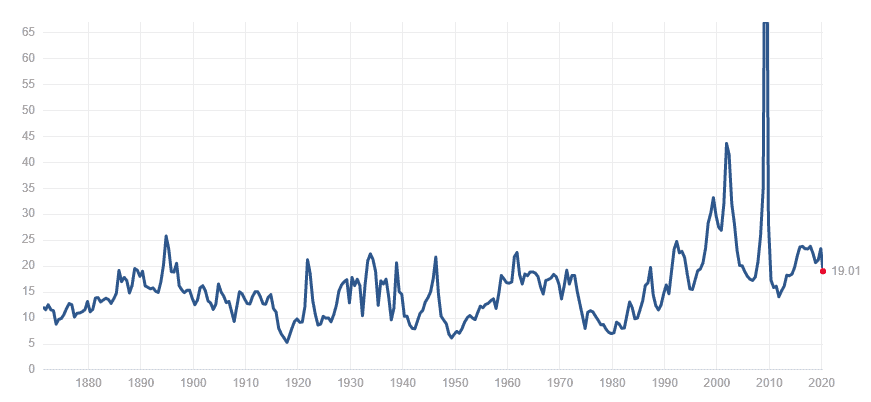
What do you think is going to happen to earnings in the coming 12 months? There are going to be huge downward revisions and at the current price level, that 19x multiple is going to increase back up to 20+ times. In the last financial crisis, the market entered the crisis with a PER multiple of 18.5x.
Using adjusted EPS numbers and PER multiples
On an adjusted basis, the S&P500 2019 EPS was $163/share. That equates to a multiple of 20.8x at the Feb 2020 peak. Bank of America is now forecasting that EPS figure to decline 29% to $115/share. At the same multiple of 20.8x, that equates to a fair value of 2389 vs. the current level of 2526, which implies another 5% downside.
The graph below from Forbes illustrates that the multiple would be at 18x (when S&P500 was at 2975) if 2020 EPS growth is flat (at $163/share)
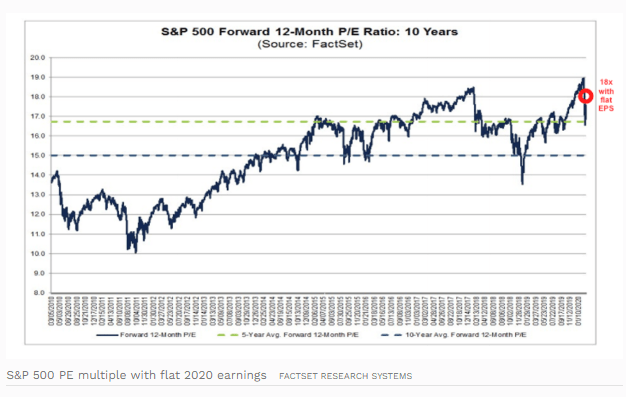
However, it is hard to justify a PER multiple of 20.8x amid potentially one of the greatest recessions in the modern era. Assuming a de-rating in PER multiples to the 5-year average multiple of 17x (based on the above chart), that will imply a fair value of 1955 on the S&P500 which is a peak to fair value price of -42% and -22% from current price level.
If we assume a derating to the 10-year average multiple of 15x, that will imply a fair value of 1725.
Moon Capital management has done a summary of PER multiple contractions during past recessions as highlighted in the table below.
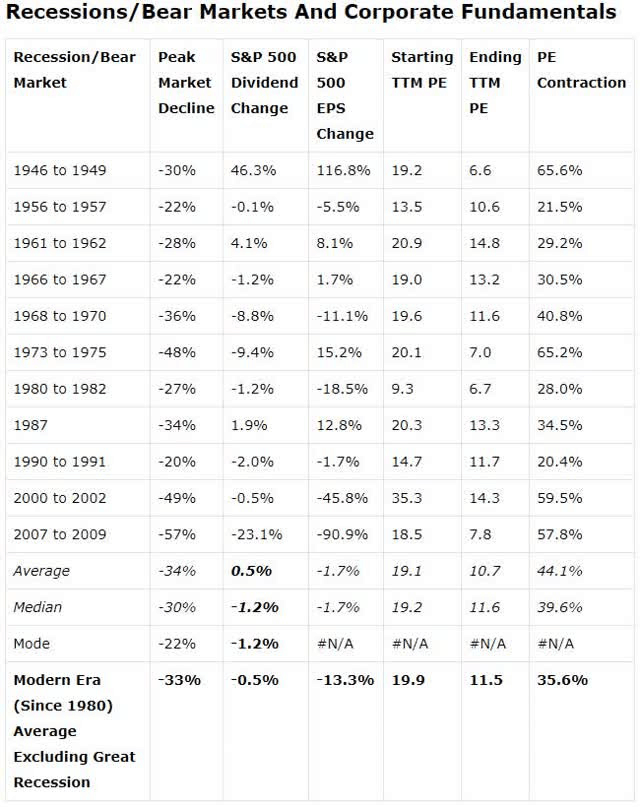
On average, excluding the great recession, PER multiples tend to contract by 35% from peak to trough. Do note that the above multiples are based on trailing 12-months from mutipl.
If adjusted peak PER multiple is 21x and there is a 35% contraction, which equates to a multiple of 13.7x, that implies a trough of 1576 for the S&P500, assuming that Bank of America 29% YoY EPS decline estimate is accurate.
Bank of New York Mellon is forecasting a 25% decline. Goldman is forecasting a 33% decline to $110/share, with 2Q20 at -123% growth, implying overall losses across S&P500 companies.
At 1576, that implies a 53% peak to “trough” decline.
I am not certain if these EPS estimates also took into consideration the fact that share buy-backs by most US companies originating from debt funding are now a thing of the past. This will mean that EPS growth due to the share buy-back factor will be seriously curtailed.
Conclusion
Earnings ultimately drive share prices. Yes, there can be earnings multiple expansion, but that should be the expectation in a bull market and not one whereby more than 50% of the world is on lockdown.
With forward adjusted EPS expected to come down in the region of 20-30%, share prices should potentially decline at least to that extent simply on a constant PER multiple. But can one justify a peak PER multiple of c.21x in today’s context?
A de-rating to 13.7x forward PER multiple could imply a further 30% share price decline and a peak to trough of 53%.
That might be the ideal time to buy stocks in this recession. Alternatively, I have shown two other methods, which is to purchase 10 months after the recession started, likely to be in Jan 2021 on our forecast (based on historical stock market trough after the recession has begun) or to start buying when NBER officially declares that a recession has started x months ago.
Once again, the content in this article is for reference purposes. I do not have a crystal ball in front of me.
Do Like Me on Facebook if you enjoy reading the various investment and personal finance articles at New Academy of Finance. I do post interesting articles on FB from time to time which might not be covered here in this website.
Join our Telegram broadcast: https://t.me/gemcomm
SEE OUR OTHER WRITE-UPS
- HOW TO BUY REITS IN SINGAPORE. 10-KEY S-REIT QUANTITATIVE FILTER (PART 1)
- WHICH ARE THE BEST TAX-EFFICIENT ETFS TO INVEST IN?
- ARE YOU OVERPAYING YOUR REIT MANAGER? WHICH S-REITS HAVE THE “HIGHEST” MANAGEMENT FEES?
- WHICH S-REITS HAVE THE BEST RECORD OF DIVIDEND GROWTH?
- 10 GREAT REASONS FOR REITS INCLUSION IN YOUR PORTFOLIO AND 3 REASONS TO BE CAUTIOUS
- WHY I AM STILL BUYING REITS EVEN WHEN THEY LOOK EXPENSIVE
Disclosure: The accuracy of the material found in this article cannot be guaranteed. Past performance is not an assurance of future results. This article is not to be construed as a recommendation to Buy or Sell any shares or derivative products and is solely for reference only.


4 thoughts on “When to buy stocks in a recession? The ideal time to pick a bottom”
Nice article and thank you for sharing
God bless you
cheong wee
hey cheong wee,
thanks for stopping by.
Your acticle have given me addtional guideline and reference.
Thanks for sharing.
hey danny,
Happy to help. Cheers