Why are S-REITs selling off?
Now might seem the worst of time to buy REITs in Singapore, or perhaps the best of time, depending on how you see it.
Since its peak on 19 Feb, the S-REIT market has essentially cratered by approx. 34% as of this writing, more than the 28% fall in the Straits Times Index.
To be honest, this is kind of surprising to me given the current down-trending interest rate environment. I guess fundamentals have all been thrown out of the window as investors clamor for cold-hard cash.
The first-rate cut by the Fed back in late-Feb was met with optimism, with S-REITs reacting positively to the news. Why not right? Lower rates equate to lower borrowing costs and better profitability.
Things were drastically different the second time around when the Fed cut rates by a full 100 bps in an emergency meeting over the past Sunday which was met with immense skepticism, with the market viewing such an act of being one taken out of desperation.
Instead of rallying stronger like what the first-rate cut might imply, the S-REIT market collapsed by more than 30% over the 10 days.
Lower borrowing cost is no longer the focal point. Instead, the market is now worried about a global recession and REITs are not immune to one.
Nonetheless, that in itself cannot explain the indiscriminate sell-off of S-REITs this past week.
A better explanation would be the forced margin calls on heavily levered positions undertaken by both retail brokerage houses and the private banks (more the latter) who previously advised their clients to lever up to purchase S-REITs, an asset class that is viewed as defensive.
What can go wrong? Particularly on blue-chip REITs such as Ascendas and the Mapletree Group of REITs.
The fast and furious liquidation of these Blue-Chip Singapore REITs, a total surprise to many, is likely the consequence of immense leverage in the system.
Is there an opportunity?
Is there thus an opportunity to hence purchase these heavily sold off S-REIT counters whose fundamentals remain sound but are unfairly beaten down due to market dynamics beyond their control? Or are they simply over-valued in the first place?
There is no simple answer to this question. I believe that the fundamentals of REITs remain in-tact to justify selective entry. There are no significant credit risks unlike GFC and while some S-REITs might see their underlying operating business negatively impacted by COVID-19 such as those in the hospitality and high-end retail segment, others such as industrial and suburban mall REITs should not see a drastic impact to their operational performance, at least at this juncture when we are yet in a full-blown recession, or possibly depression.
For myself, in the current S-REIT sell-off, I turn to my checklist of 10 key metrics when deciding which REITs in Singapore to buy. This provides me with a quick and easy solution to filter and identify REITs in Singapore which might be undervalued, based on business fundamentals and “price attractiveness”.
For each of the 10 metrics, I associate a weighting to it. For example, I view a steady DPU growth trend as more important vs. its current Price/NAV. Hence for the former, I tag a weighting of 18% compared to the latter with a 5% weighting.
Each metric is then given a scoring system of 1-5 points. For example, if a REIT has 4 years of YoY DPU growth, it will be awarded 5 points. If there is zero YoY DPU growth recorded, it will be awarded 1 point.
The points are then weighted across their respective criteria weighting and the points summated to get its final score. The max score is 5 and any REITs with a score above 3.5 will be under-consideration.
Note that these 10-key metrics on evaluating which REITs in Singapore are attractive to buy is just the first step in the purchase decision. The next step will then be to evaluate more subjective areas such as management remuneration profile, acquisition growth pipeline, etc, rental revision trend, etc. This will be covered in Part 2 of our article.
Let me now briefly go through each criterion.
How to buy REITs in Singapore. The 10 key focal points.

Metric # 1: No of years with NPI Growth
A REIT Net Property Income or NPI for short, is essentially its gross revenue minus property maintenance fees, property taxes, and other operating expenses that are related directly to the property.
It is a key barometer to evaluate how well a REIT’s portfolio of properties is performing as well as the rise/fall in their associated costs.
Using this metric, one can have a quick overview of how the REIT can grow its revenue, be it from higher rentals or acquisitions. A steady rising NPI growth every year illustrates the REIT’s ability to grow revenue by rental hikes which is a good sign.
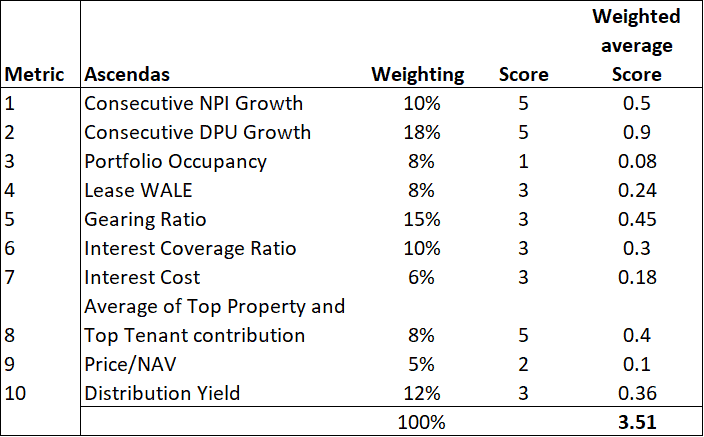
Using Ascendas REIT as an example, the REIT has demonstrated 4 years of YoY NPI growth as seen from the table below. As such, it will be given 5 points for this metric.

For this metric, we associate a 10% weighting.
Metric # 2: No. of years with DPU growth
A REIT distribution per unit or DPU for short is what it pays out as dividends to unitholders. Consistent DPU growth should be one of the most important criteria when evaluating a REIT, in my opinion.
Theoretically, a REIT that shows a consistent NPI growth should also be demonstrating the same positive growth trend in its DPU. However, that might not be the case due to changes in finance cost, etc.
A REIT’s ability to manage its finance cost, the REIT manager’s remuneration payment and other non- property expenses well will determine if it can translate NPI growth into DPU growth.
We have written about the track record of S-REITs dividend growth in this article: Which S-REITs have the Best record of dividend growth.

For Ascendas REIT, the REIT has been able to translate its 4-years consecutive NPI growth into DPU growth as shown in the table below, hence it gets 5 points.
For this metric, we associate an 18% weighting.
Metric # 3: Portfolio Occupancy/Revenue per available room
A REIT’s property portfolio occupancy illustrates the attractiveness of its property. A property with a close to 100% occupancy rate is likely highly sought after and will be able to command a rental premium or a positive rental revision in the next lease cycle.
A property with a low occupancy rate might be finding it a challenge to lease out its property units which might translate to a rental discount.
However, in a rising rental market environment, property at 100% occupancy rate with a long WALE (where leases are locked in) might be viewed as a disadvantage due to its inability to raise rental during this period.

For Ascendas REIT, the overall Group’s Portfolio Occupancy rate is rather weak at 90.9% as of 31 Dec 2019. Hence for that, it only gets 1 point. However, it might be unfair to penalize Ascendas REIT based on a low portfolio occupancy rate, particularly if it is associated with a strong rental reversion trend. We will touch on rental reversion in Part 2 of our article.
For this metric, we associate an 8% weighting. For the hospitality REITs, portfolio occupancy is replaced by Revenue per Available Room (RevPAU) as the evaluation criterion, with the same 8% weighting.
Metric # 4: Portfolio Weighted Average Lease Expiry
A REIT’s Portfolio Weighted Average Lease Expiry or WALE for short, as the name implies, illustrates how long its portfolio of properties is being leased out for.
A long WALE will give investors’ assurance of revenue stability whereas a short WALE might present concerns over rental renewal.
For Singapore properties, properties’ WALEs are typically much shorter than those properties based in the US, AUS, UK or Europe. Long WALEs typically do have a rental escalation clause built in the contract to ensure a certain level of revenue growth visibility.

For Ascendas, its portfolio WALE stood at 3.9 years as of 31 December 2019. It gets 3 points for metric.
For this metric, we associate an 8% weighting.
Metric # 5: Gearing Ratio
A REIT’s gearing ratio, defined as its total borrowings divide by total assets, is one of the most important metrics when evaluating a REIT.
Currently, the Monetary Authority of Singapore (MAS) has a 45% leverage ceiling for all S-REITs. This was likely taken post-GFC when REITs then were more significantly leveraged and faced credit concerns when the global banking system froze up. As banks do not wish to refinance (partially due to concerns over REITs leveraged balance sheet), S-REITs found themselves in a situation where they had to turn to the capital market in the form of rights issuance just when their prices were heavily sold off.
Today, most REITs gearing ratios are significantly lower vs. GFC period. For Ascendas, its latest gearing ratio is 35.1% which earns it 3 points in this category.

For this metric, we associate a 15% weighting.
Metric # 6: Interest Coverage Ratio
A REIT’s interest coverage ratio measures the number of times its EBITDA can cover its interest expense.
An interest coverage ratio of 3x is often considered a benchmark for being able to cover fixed charges.
This metric is somewhat related to the gearing ratio. A high-interest coverage ratio might be able to help compensate for the “relatively” higher gearing ratio, something which the lender will likely take into consideration when evaluating the credit risk profile of the REIT.
A REIT might illustrate a lower-than-average gearing profile. However, if its operations are not generating sufficient operating profits (based on EBITDA), it will have a low-interest coverage ratio which is a key cause for concern.
For Ascendas REIT, it has an interest coverage ratio of 5.4x which is considered average. It gets 3 points for this metric.
For this metric, we associate a 10% weighting.
Metric # 7: Interest Cost
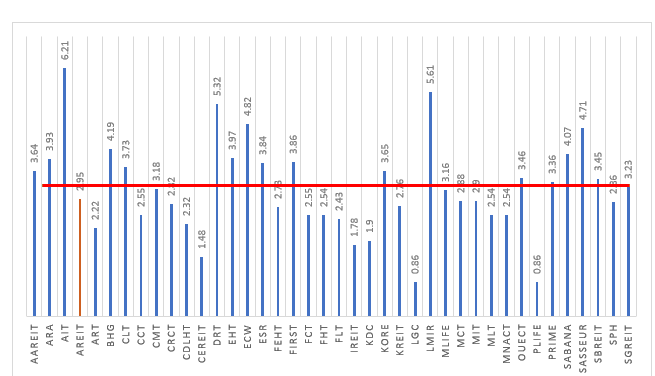
A REIT’s interest cost will demonstrate its ability to secure cheap funding. This ties back to the resilient-nature of its business. For example, a REIT like Keppel DC REIT has one of the lowest interest costs in the industry at 1.9% compared to all the other S-REITs with key operations based in Singapore.
Typically, REITs with assets based overseas can secure a much cheaper cost of debt as compared to those with Singapore-based assets. However, REITs currently already enjoying a low cost of debt might not be able to benefit further from a lower-trending interest cost environment.

Ascendas REIT cost of debt currently stands at 2.95% which is slightly lower than the sector average of 3.2%. For that, it gets 3 points.
For this metric, we associate a 6% weighting
Metric # 8: Average of Top Property and Top Tenant contribution
We look to avoid concentration risk relating to an individual property as well as to tenants. A prime example would be the negative impact that Festival Walk had on Mapletree North Asia Commercial Trust when this key property was damaged during the HK protest period. Festival Walk accounted for 64% of Mapletree North Asia Commercial Trust’s revenue, hence any disruption to this one asset will have a huge impact on the REIT’s overall operational performance.
The same can be said for the key tenant which encompasses a huge proportion of a REIT’s revenue. This presents significant concentration risk and their departure might cause a substantial problem in finding new lessees to fill up the gap.
Ascendas REIT scores very well in terms of diversification, with its average percentage for this metric at a low 4.9%. It gets a score of 5.
For this metric, we associate an 8% weighting
Metric # 9: Price to NAV
This metric takes into consideration a REIT’s valuation, particularly it’s market capitalization over its net asset base.
Given that REITs are all asset-heavy, there is little argument here about how an asset-light company might seem hugely over-valued based on its price-to-book ratio.
While a multiple above 1x might indicate a certain level of over-valuation, it might not necessarily mean that the REIT makes for a poor investment.
We notice that most of the bigger blue-chip companies are trading more than 1x book while smaller-cap REITs are trading at a discount to their book.

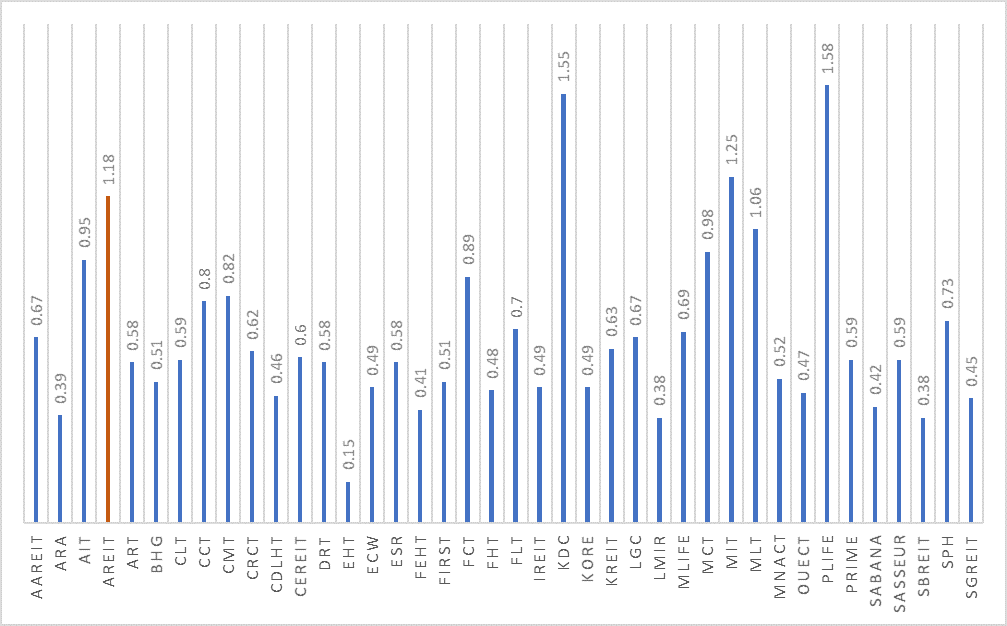
For Ascendas, following the past two weeks of sell-down, the counter is now trading at 1.11x P/NAV, still one of the highest in the industry. The S-REIT Industry now has an average Price/NAV of 0.67x, one of the lowest I have seen in years. It gets a score of 2 for this metric.
For this metric, we associate a 5% weighting
Metric # 10: Distribution Yield
A REIT’s distribution yield is one of the key focal points when it comes to assessing the attractiveness of a REIT as an income-generating asset.
Most of the time, we like a high distribution yield REIT counter vs. a lower one but that has to be evaluated alongside the sustainability of such dividend payments to assess if the REIT is indeed attractive.
For example, the distribution yield of Eagle Hospitality Trust is now at a mind-boggling 43%. That could be due to the significant share price correction of Eagle Hospitality Trust in recent days. However, one will need to evaluate the feasibility of the trust to continue the same DPU payment. Given the lack of DPU track record, it is difficult to be assured that Eagles Hospitality Trust DPU amount can be maintained (and hence achieve the distribution yield of 43% based on current price).
On the other hand, Ascendas REIT has demonstrated that its DPU payment has been extremely stable, with consecutive DPU growth over the past 5 years (Metric 2).
Hence, we are more assured that Ascendas DPU can be maintained (even if there might not be growth) vs. Eagle hospitality Trust.
Ascendas REIT distribution yield now stands at 6.5%. For that, it gets a score of 3 points.
For this metric, we associate a 12% weighting.
The overall score for Ascendas REIT based on our scoring system

Ascendas REIT has a total weighted average score of 3.51, which narrowly qualifies for our consideration list. Currently out of the 43 REITs listed in Singapore, 12 of them have a weighted average score of 3.50 or more.
My friend Vince from REIT-tirement has got a comprehensive SREITs Data spreadsheet screener where I enlisted his help to incorporate the above scoring system. The table also includes other useful information such as Yield, Price/NAV, 52-weeks high/low, Gearing, etc. From this table, you can easily identify those counters (12 of them at present) with a score of 3.5 and above.
S-REITs Data spreadsheet screener
One can refer to this web page for the latest S-REIT information. Do note that the information is provided on a best-effort basis using Yahoo Finance and might not be 100% accurate.
Conclusion
This is Part 1 of our analysis on How to Buy REITs in Singapore. We introduced a simple scoring system based on 10 key metrics which I see as a good starting point to evaluate a REIT.
Without having to spend too much time considering each S-REITs available here, I filter it down to the 12 BEST S-REITs based on this scoring system, which takes into consideration both operational fundamentals of the individual REITs as well as their “price attractiveness”. From there, I will proceed to evaluate other non-quantifiable/less quantitative traits such as looking at the acquisition pipeline, REIT managers remuneration scheme, rental reversion trend (different REITs report their rental reversion methodology differently), etc before coming up with a final purchase decision.
This will be covered in Part 2 of our analysis: How to Buy REITs in Singapore. 8 additional factors to consider (Part 2)

Do Like Me on Facebook if you enjoy reading the various investment and personal finance articles at New Academy of Finance. I do post interesting articles on FB from time to time which might not be covered here in this website.
Join our Telegram broadcast: https://t.me/gemcomm
SEE OUR OTHER WRITE-UPS
- GUIDE TO SYFE AND HOW TO OPEN AN ACCOUNT IN LESS THAN 10 MINUTES
- WHICH ARE THE BEST TAX-EFFICIENT ETFS TO INVEST IN?
- ARE YOU OVERPAYING YOUR REIT MANAGER? WHICH S-REITS HAVE THE “HIGHEST” MANAGEMENT FEES?
- WHICH S-REITS HAVE THE BEST RECORD OF DIVIDEND GROWTH?
- 10 GREAT REASONS FOR REITS INCLUSION IN YOUR PORTFOLIO AND 3 REASONS TO BE CAUTIOUS
- WHY I AM STILL BUYING REITS EVEN WHEN THEY LOOK EXPENSIVE
Disclosure: The accuracy of the material found in this article cannot be guaranteed. Past performance is not an assurance of future results. This article is not to be construed as a recommendation to Buy or Sell any shares or derivative products and is solely for reference only.


4 thoughts on “How to buy REITs in Singapore. 10-key S-REIT quantitative filter (part 1)”
Follow
Thanks for mentioning, lol.
How to attend the talk
Hey Tony, what talk are you referring to?