

Key Financial Ratios for Beginners
Ever wanted to discover a good company before its stock price took off? Knowing your basic ratios for fundamental analysis is the key step to doing so.
Financial ratios allow investors to convert raw data from financial statements into concise, actionable information, empowering them to make more informed decisions when it comes to their investments.
This information can be used to evaluate performance, compare companies and industries and conduct fundamental analysis.
We have collated some of the most common and vital financial metrics, and, to top it off, grouped them under the umbrellas of market, profitability, liquidity, leverage, and activity. These are the 15 most important key financial ratios you will need to know.
Key Financial Ratios: Market Ratios
Market ratios (also known as price or valuation ratios) are probably the first type of ratio you will encounter while analyzing stocks.
The share price of a company is often used as a factor in these ratios. Their main purpose is to analyze whether share prices are overvalued or undervalued.
Market ratios are also known as relative metrics. This means that they are useful for comparing multiple companies or comparing company performance over time.
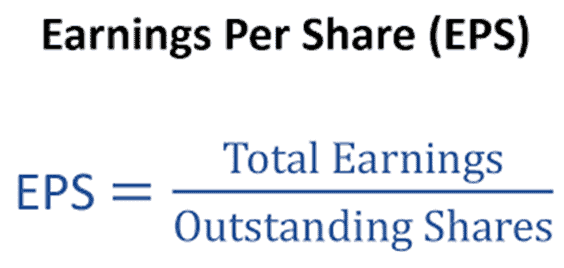
1. Earnings Per Share (EPS)
Earnings per share (EPS) is one of the most fundamental metrics in financial analysis. It measures the profitability of a company.
Note: The word earnings is used interchangeably with profits in investing, and is distinct from revenue, which is synonymous with sales.
For investors who are interested in a steady source of income, the EPS ratio can indicate the room a company has for increasing its existing dividend.
EPS is calculated by dividing the company’s total income by its number of outstanding shares.
The higher the earnings per share of a company, the better is its profitability. It is however meaningless to compare the absolute EPS figure of Company A vs. that of Company B since both companies have different share prices to begin with.
Take for example, Company A has a share price of $100/share and a full-year EPS of $10. Company B has a share price of $1,000/share and a full-year EPS of $20. By comparing their absolute EPS on a standalone basis, it would seem that Company B is the better company, with its EPS 2X that of Company A.
However, when we compare against their share prices, Company A has an earnings yield (EPS/Price) of 10% while that of Company B has an earnings yield of just 2%. The higher the earnings yield, the “more undervalued” is the company.
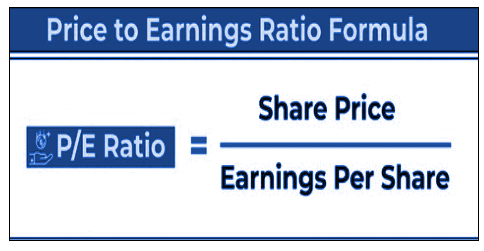
2. Price-Earnings (P/E) Ratio
Enter the one metric that everyone has heard of – the price-to-earnings ratio (P/E ratio). The P/E ratio helps investors determine whether the stock price is over-or undervalued, relative to the company’s earnings.
In simpler terms, the ratio is the amount an investor must pay for each dollar of earnings.
It is calculated by dividing a company’s share price by its earnings per share (EPS). The inverse of the P/E ratio is the Earnings Yield (EPS/Price) as we have highlighted earlier.
If the P/E ratio is high, the market price is high relative to the company’s true value, which may signify overvaluation or expectations for future growth. If the P/E ratio is low, it could indicate that the company is undervalued by prevailing market prices.
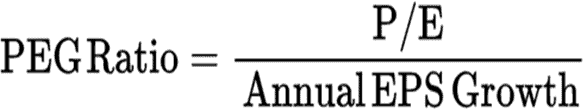
3. Price/Earnings Growth (PEG) Ratio
Recall that the P/E ratio may be high due to investor expectations for future growth? Turns out, since investing is all about the future, there is a metric that takes that into account as well.
That metric is known as the Price/Earnings Growth (PEG) ratio. It adjusts the price-to-earnings (P/E) ratio by including the factor of the expected growth of earnings.
The PEG ratio is used to determine a stock’s value while also factoring in the company’s expected earnings growth, and it is thought to provide a more complete picture than the more standard P/E ratio.
It is calculated by dividing the P/E ratio by the growth rate of its earnings for a certain period, usually a year.
Similar to the P/E ratio, a higher PEG may indicate that a stock is overvalued, and vice versa.
In general, a value below 1 may indicate that the stock is undervalued, whereas a value above 1 may indicate that it is overvalued.
Do be warned that there are nuances to this ratio. The PEG for a given company may differ significantly from one reported source to another, depending on which growth estimate is used in the calculation, such as one-year or three-year projected growth.
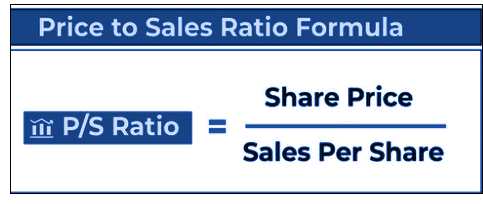
4. Price-to-Sales (P/S) Ratio
The price-to-sales (P/S) ratio measures a company’s share price in relation to its sales per share. This is the price investors must pay for each dollar of revenue the company earns.
The price-to-sales ratio is similar to the price-to-earnings ratio, but it uses revenue instead of earnings. This makes it one of the best ratios to evaluate a company that failed to reap profit within the last year but may have generated a good amount of revenue.
An important distinction: revenue or sales is the income a company generates before deducting expenses. Earnings, on the other hand, represents the profit a company has earned; it is calculated by subtracting expenses, interest, and taxes from revenue.
The P/S ratio can be calculated by dividing a company’s market capitalization by its total revenue within a given period. It can also be calculated by dividing its current share price by its sales per share.
Similar to the previous ratios, a lower value may show that the stock is undervalued, whereas a higher value may show that the stock is overvalued.
Like the P/E ratio, it is a relative metric, meaning it can be used to compare against other companies or industries.
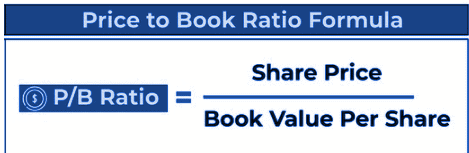
5. Price-to-book Value (P/B) Ratio
The price-to-book (P/B) ratio measures the market’s valuation of a company relative to its book value, indicating the price investors must pay for each dollar of book value.
The book value means the value of a business according to its books or accounts, as reflected on its financial statements. Theoretically, it is what investors would get if they sold all the company’s assets and paid all its debts and obligations.
The P/B ratio is calculated by dividing the company’s share price by its book value per share.
Book value per share can be calculated by a company’s net assets (total assets minus total liabilities) per share.
P/B ratios under 1 are typically considered solid investments for value investors.
Like the price-to-earnings ratio and price-to-sales ratio, it is a relative metric, better suited for comparisons against other companies and industries.
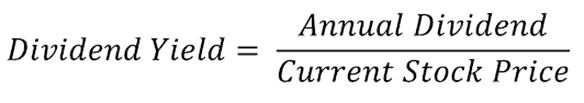
6. Dividend Yield
The dividend yield is a useful financial ratio that measures a company’s annual dividend payouts relative to its stock price. Expressed as a percentage, it indicates the number of dividends shareholders receive for each dollar of the company’s stock.
The dividend yield is a classic method of measuring return on investment, particularly for investors who prioritize dividend payouts over capital gains.
It is calculated by dividing dividend per share by price per share (then multiplying by 100 to obtain a percentage)
A decent dividend yield would generally be between 3% to 5%, though that number may fluctuate between different industries.
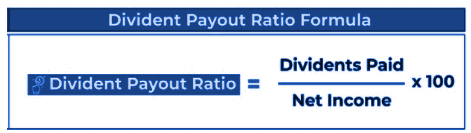
7. Dividend Payout Ratio
The dividend payout ratio measures the amount of dividends a company pays to its shareholders relative to its net income, thus indicating the proportion of earnings that get distributed as dividends.
The dividend payout ratio is calculated by dividing dividends paid by net income, then multiplying by 100.
Broadly speaking, a dividend payout ratio of 40% is considered decent, but again, that number may fluctuate depending on the industry and a multitude of other factors.
A lower ratio is not automatically a bad sign, as it may indicate that more of its earnings are reinvested back into the company, which may promote growth in the long run.
Key Financial Ratios: Profitability Ratios
This next category of ratios measures a company’s ability to generate earnings/profit in relation to its revenue/sales, costs, equity, and assets. In other words, they indicate how efficiently a company can convert its resources into income.
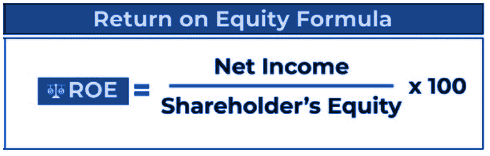
8. Return on Equity (ROE)
As one of the most widely known profitability ratios, return on equity (ROE) reflects a company’s ability to make profits relative to its shareholders’ equity. Technically, ROE is the amount of profit generated for each dollar of shareholders’ equity.
You can calculate ROE by dividing net income by shareholders’ equity, then multiplying by 100.
Net Income
Also referred to as net earnings or net profit, net income is simply the company’s profits after deducting its expenses.
Shareholders’ Equity
Shareholders’ equity is the net amount of a company’s assets and liabilities. If shareholders’ equity is positive, a company has enough assets to pay its liabilities; if it’s negative, a company’s liabilities surpass its assets.
To find a company’s shareholders’ equity, look to its balance sheet.
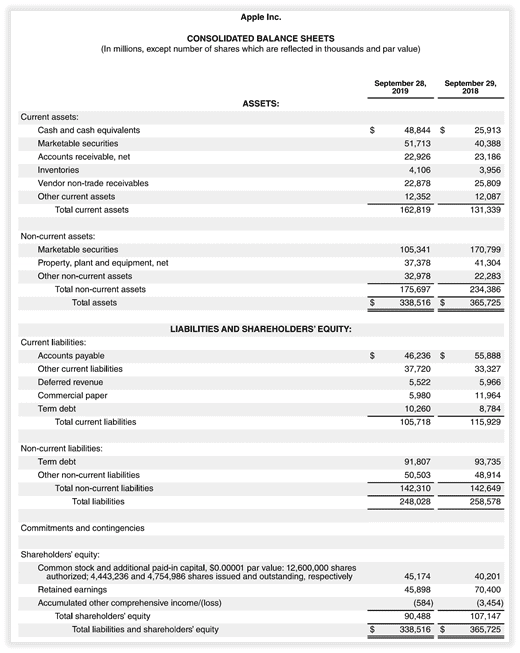
Balance Sheet
A balance sheet is a financial statement that reports a company’s assets, liabilities, and shareholders’ equity.
It is one of the 3 important financial statements alongside with Income Statement and Cash Flow Statement. Together, they give a picture of a company’s financial health.
Below is a real-life example of Apple’s balance sheet in June 2019.
Returning to the ROE ratio, the higher the number, the better the company’s ability to generate income from its available resources. Generally, an ROE above 10% is considered a decent percentage.
Additional Reading: What is ROE? Which S&P 500 stocks have strong ROE ratios
9. Return on Assets (ROA)
Return on assets (ROA) measures a company’s ability to generate income from its available resources. It reflects how much profit can be derived from each dollar of assets owned by the company.
A company’s ROA is calculated by dividing its net income by total assets, then multiplying by 100.
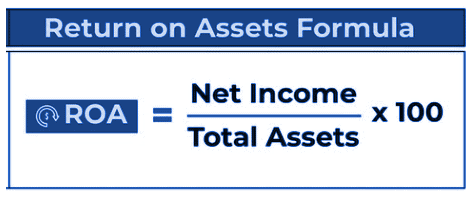
The higher the ROA, the better the company is at generating profit from the same amount of resources. Generally, a ROA above 5% is considered an efficient percentage.
10. Return on invested capital (ROIC)
The most complicated profitability ratio out of the three selected, return on invested capital (ROIC) measures how efficiently a company is using the investors’ funds to generate profit. More specifically, it is the percentage return that a company earns on invested capital.

A company is thought to be creating value if its ROIC exceeds 2% and destroying value if it is less than 2%.
Net Operating Profit After Tax (NOPAT)
NOPAT helps investors focus solely on the revenue and income growth of a company by disregarding interest paid on debt. Therefore, it is an important metric in determining how viable a business is now and will be in the future.
To determine how a company is performing without considering its debts or leverage, NOPAT is calculated by multiplying their operating profit (before deducting for interest expense) by one minus the tax rate.

Invested capital
Invested capital is the total amount of money raised by a company by issuing securities to equity shareholders and debt to bondholders.
A simpler formula when calculating ROIC vs. ROE is to add total debt to the equity figure when calculating the former ratio. Hence, a simplified ROIC formula = Net Profit / (Total Shareholder Equity + Total Debt)
Additional Reading: The best predictor of stock price performances
Key Financial Ratios: Liquidity Ratios
Liquidity ratios indicate whether a company has sufficient cash and assets to meet its short-term debt obligations. These strategic financial metrics can be used to measure the financial health of a company or used for comparison with other companies.
11. Current Ratio
Also called the working capital ratio, the current ratio measures a company’s ability to cover its current liabilities (debts due within a year) by using its current assets (assets that can be converted into cash in a year). Specifically, the current ratio indicates how many times current liabilities can be covered by current assets.
It is calculated by simply dividing current assets by current liabilities, which are both information available on the company’s balance sheet.
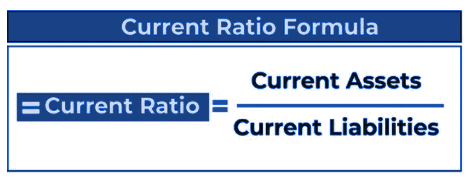
The higher the current ratio, the better the company can cover its liabilities. A ratio above 1 signifies that the company has more current assets than current liabilities, whereas a ratio below 1 indicates otherwise.
12. Quick Ratio
Also known as the acid-test ratio, the quick ratio measures a company’s short-term (hence “quick”) ability to cover its current liabilities with its most liquid assets. It is more conservative than the current ratio as it excludes prepaid expenses and inventory from the assets, which can take a longer time to be turned into cash.
Difference between quick ratio and current ratio
What is included in current assets:
- Cash and cash equivalents
- Marketable securities
- Accounts receivable
- Prepaid expenses
- Inventory
What is included in liquid assets:
- Cash and cash equivalents
- Marketable securities
- Accounts receivable
The quick ratio is calculated by dividing liquid assets by current liabilities.
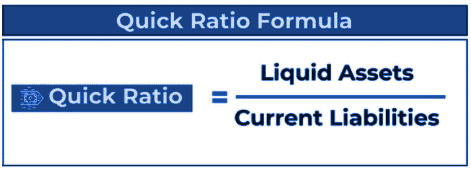
The higher the quick ratio, the better the company can cover its liabilities in the short term. A value above 1 indicates that the company can immediately pay off its current liabilities using its liquid assets. A value below 1 indicates otherwise.
Key Financial Ratios: Leverage Ratios
Leverage ratios measure the amount of debt a company incurs relative to its assets. They provide important information about the company’s ability to meet financial obligations and how it uses debt and equity to fund its operations.
13. Debt-Equity (D/E) Ratio
Also known as the debt-to-equity ratio, the D/E Ratio measures two things: first – the degree to which its operations are funded by debt, and second – whether shareholders’ equity (net amount of assets and liabilities) can cover total liabilities.
The debt-equity ratio is calculated by dividing total liabilities by total shareholders’ equity.
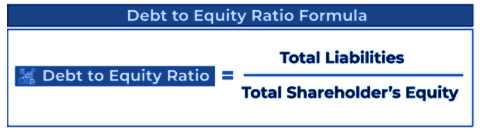
A D/E ratio greater than 1 indicates that the company has more debt, while a value below 1 indicates less debt.
It should be noted that a higher D/E ratio is not automatically a bad sign. Incurring debt can also help firms raise their growth potential.
Key Financial Ratios: Activity Ratios
Activity ratios, also known as operating or efficiency ratios, measures how fast a company can generate revenue from its resources. It functions as a gauge of the efficiency of an operation; i.e. the rate at which cash is collected and products are sold.
14. Asset Turnover Ratio
The asset turnover ratio measures how quickly a company can generate revenue from its assets.
Turnover refers to the total sales by a business in a certain period.
Asset turnover is calculated by dividing net sales (total revenue) by average total assets, which are information that can be obtained from the company’s income statement.
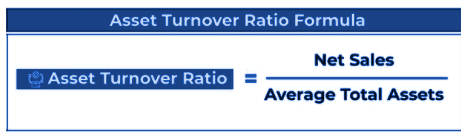
The higher the asset turnover ratio of a company, the greater its efficiency in generating sales from assets. Generally, a number greater than 1 indicates that the company is efficient.
15. Inventory Turnover Ratio
The inventory turnover ratio measures the number of times a company sells its inventory within a given period. It is used to determine how effectively a company’s inventory (products ready to be sold and raw materials) is managed.
The inventory turnover ratio is calculated by dividing the cost of goods sold (COGS) by average inventory.
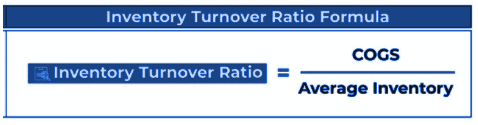
The cost of goods sold (COGS) is the direct expenses related to producing a good or service and is listed on the company’s income statement.
A higher inventory turnover ratio may indicate that products are being sold quickly or that inventory levels are insufficient. A lower value can indicate that products are being sold slowly, inventory is becoming obsolete, or inventory levels are in excess.
Conclusion
It is virtually impossible to know all the key financial ratios out there, but fear not – investors only tend to focus on a handful of them. Often, the most effective stock analysis should not be overcomplicated but instead kept as simple as possible.
Do Like Me on Facebook if you enjoy reading the various investment and personal finance articles at New Academy of Finance. I do post interesting articles on FB from time to time which might not be covered here in this website.
Join our Instagram channel for more tidbits on all things finance!
SEE OUR OTHER WRITE-UPS
- Dollar Cost Averaging vs Lump Sum Investing. Which is more suitable for you?
- Stocks vs Bonds vs ETFs vs Mutual Funds: A Beginner Primer
- 4 Most Favoured Types Of Investment In Singapore For Inflation-beating Returns
- Cash Secured Put: Generating passive income the right way
- 4 Steps to understanding your Investment Time Horizon
- Beginners Guide to CryptoCurrencies and how to get started in 2021?
Disclosure: The accuracy of the material found in this article cannot be guaranteed. Past performance is not an assurance of future results. This article is not to be construed as a recommendation to Buy or Sell any shares or derivative products and is solely for reference only.


