
If you’re serious about investing in companies, you’d want a good source of historical financial data. These metrics are extremely important and give you a good idea of how a company is doing financially.
Balance sheets, cash flow statements, and income statements are extremely important, and some platforms provide pretty handy analyses to help you consolidate the financial data more efficiently. Let’s dive into the various ways you can obtain such data at no cost at all.
For those who are interested in finding top websites and apps for free Financial News, I have also written a comprehensive article previously which one can access in the link below:
Additional Reading: Top websites and apps for free financial news
Yahoo Finance
Yahoo Finance is a well-known platform to obtain crucial data like ticker prices, important and relevant news articles, and of course, financial data.
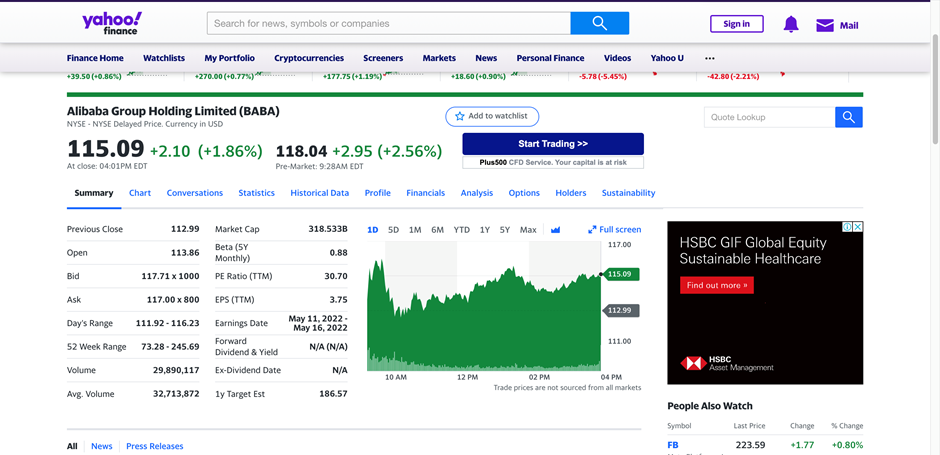
Firstly, under the ‘Summary’ tab, you’ll be able to obtain a brief snapshot of some key financial metrics concerning the company stock. This includes PE ratio, earnings per share, 52-week range, and many more. This saves you the hassle of combing through an endless table of numbers to obtain these metrics.
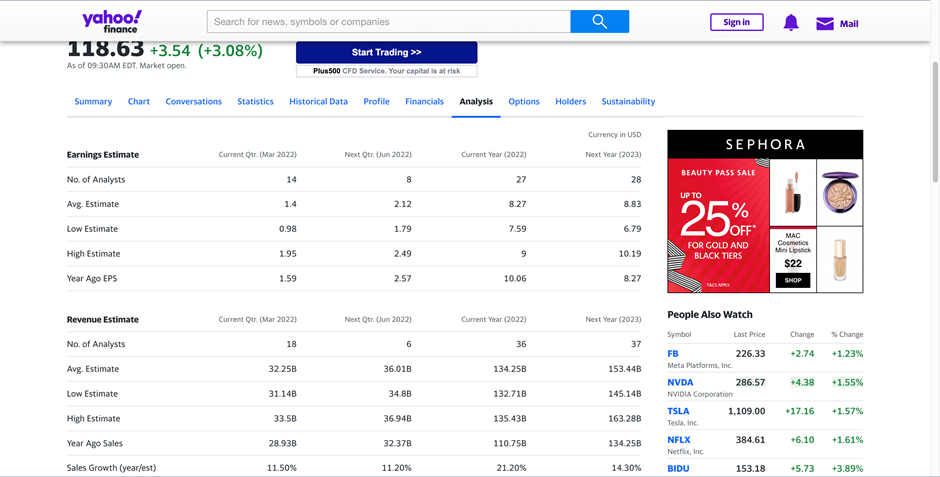
Another extremely helpful feature is the ‘Analysis’ tab, which brings you to a page that provides analyst estimates for various technical indicators. This includes earnings, revenue, EPS, and growth estimates.
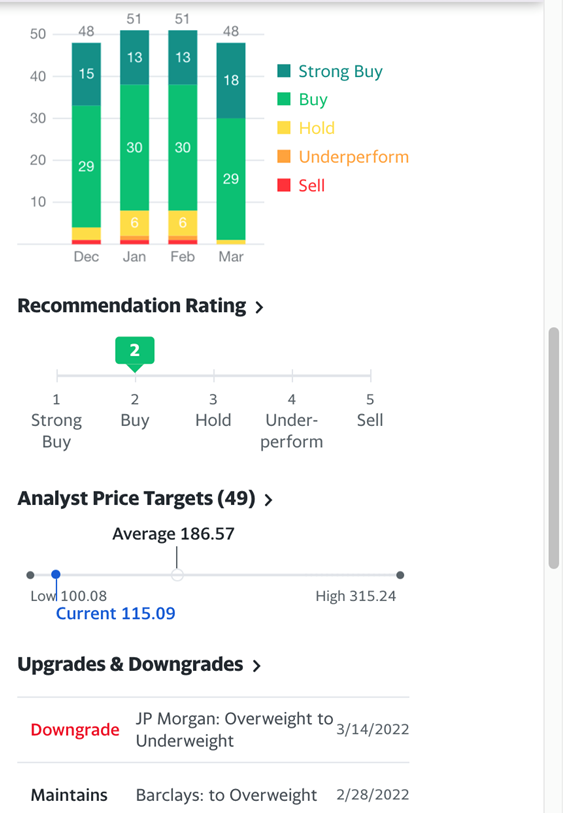
You’re also able to see stock ratings initiated by renowned institutions. This would give you a decent gauge of where the company is at in terms of its valuation, based on experts’ opinions and analyses. This is extremely helpful when you’re unsure of how to project a company’s growth potential, which would subsequently be a key factor in determining the fair value of its stock price.
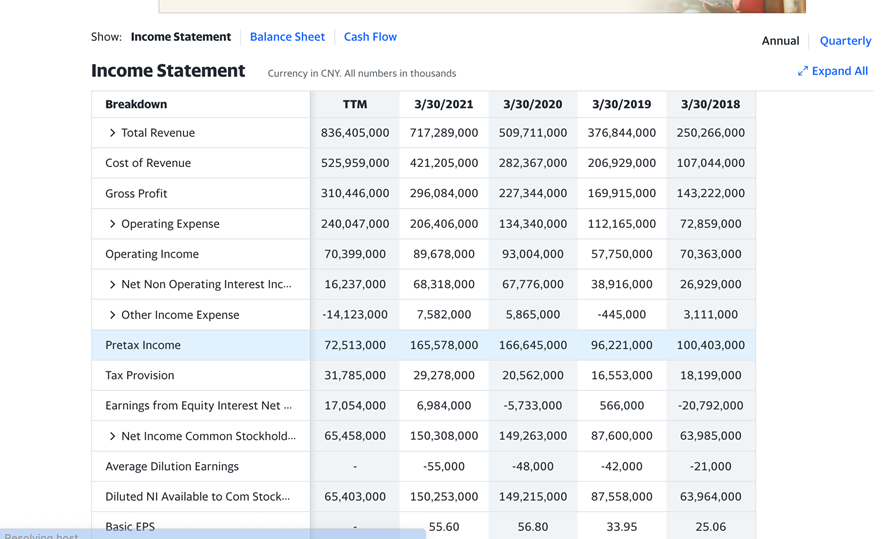
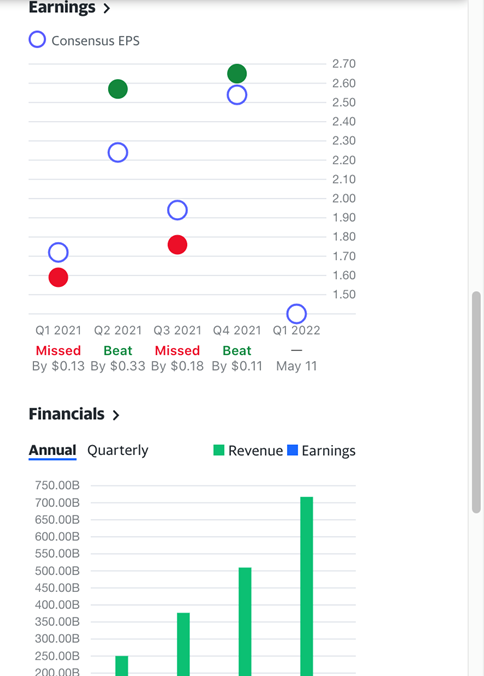
The ‘Financials’ tab allows you to view all key financial statements. It also gives you a graphical representation of the company’s financial performance in terms of revenue and earnings. This helps you to better evaluate your investment decisions since any information related to the company’s financials is at your fingertips.
Marketwatch
Marketwatch website is a reliable and easy way to obtain historical financial data.
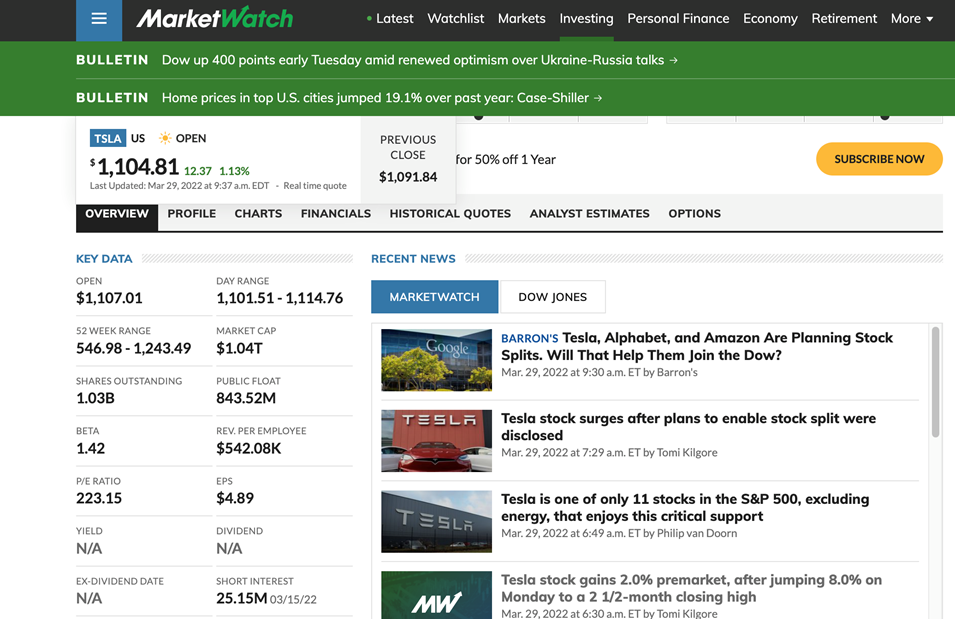
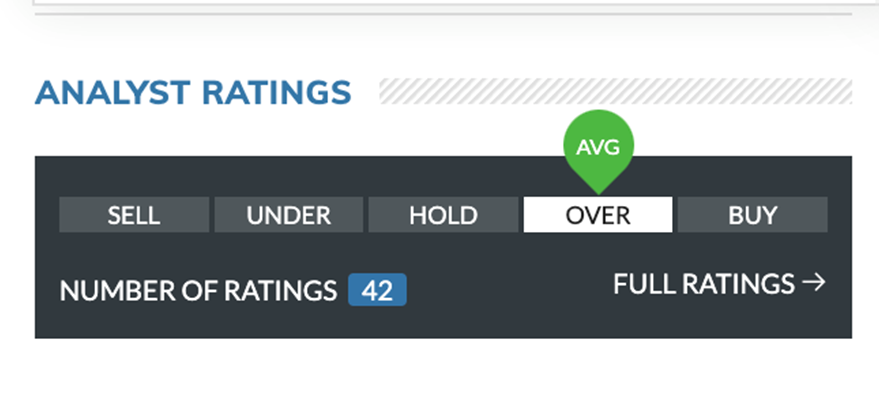
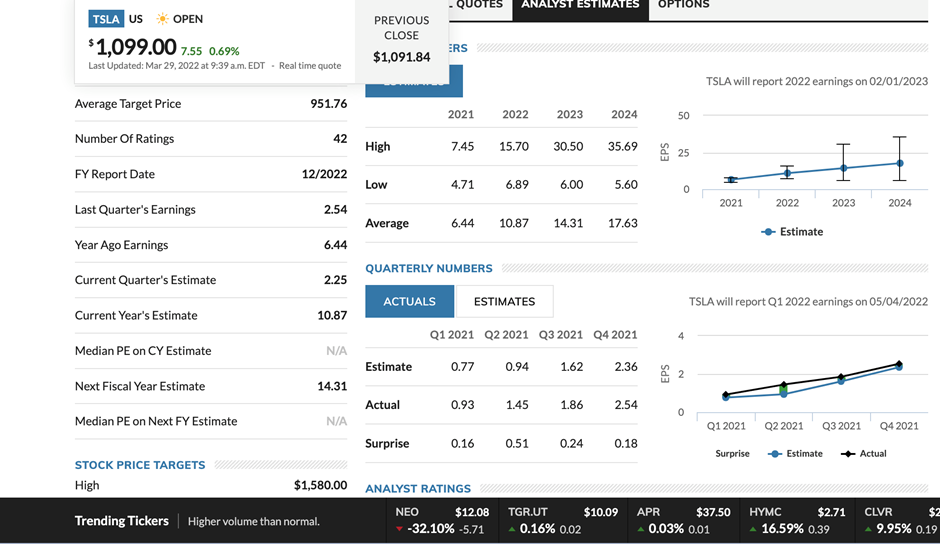
The ‘Overview’ section provided you with the key financial metrics of a company, and also shows you a brief graphical representation of analyst ratings. Going into ‘full ratings’ allows us to obtain detailed analyst estimates for different financial metrics. Information on analyst price targets is also provided, which would give you a good gauge of where the company’s stock price is relative to where experts expect it to be.
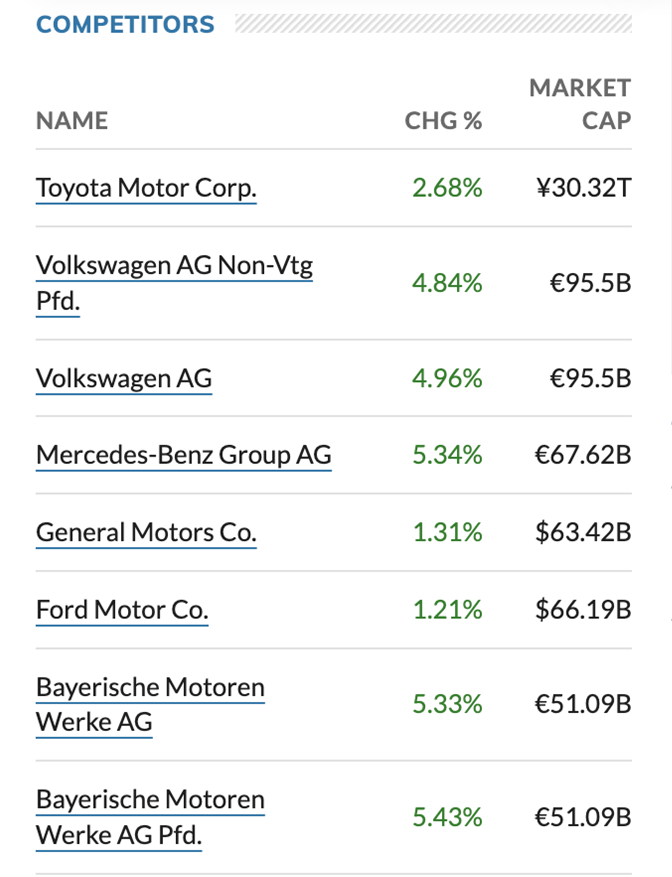
One thing I like about Marketwatch is that you can very easily obtain a detailed list of the company’s competitors. This is especially helpful if you’re interested in the industry, or if you’re using a stock valuation method that requires financial data of competing companies in the same industry.
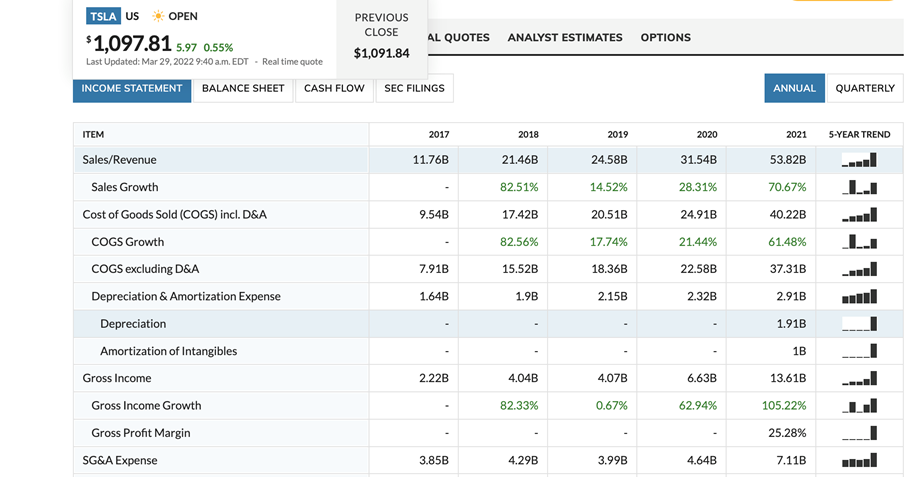
Finally, we have the ‘Financials’ page which gives you everything you need to know about a company’s financials. From experience, Marketwatch is one of the most accurate and informative sources when it comes to financial reports. You’re able to find just about any financial metric, which is greatly helpful if you’re using stock valuation methods that require these numbers, like a discounted cash flow analysis.
Finviz
Speaking of price targets, Finviz is a website that provides a detailed visual representation of each price target that has been set (by institutions) for a company’s stock. The site doubles as a good source of financial data, which helps you further om evaluating the company.
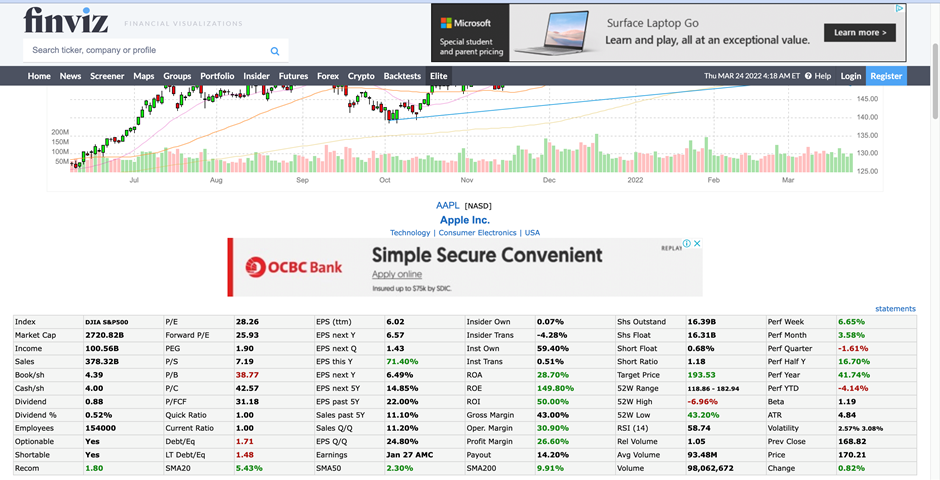
Firstly, you can see a quick snapshot of all relevant financial metrics of any company on this website, along with a big and detailed graph of its stock price over a given period. This is an extremely convenient way of obtaining certain metrics and making a brief evaluation of the company at first glance.
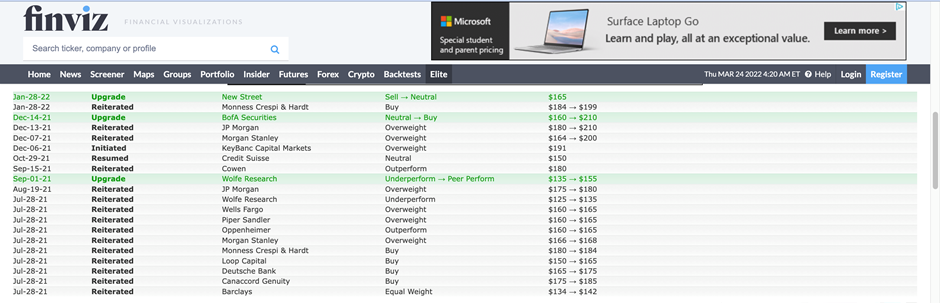
Scrolling down a little would reveal the price targets (set by various institutions) for the company, along with the date it was set, and a stock rating. This section also highlights any changes in price targets made by these institutions. This is one of the most accurate and hassle-free methods to obtain analyst price targets.
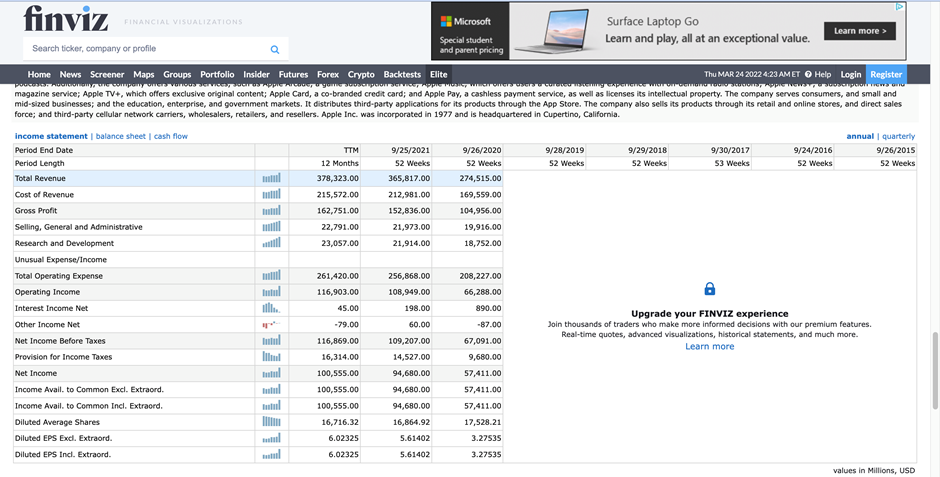
The website also provides key financial statements over the past few years. However, a small drawback is that there’s a limit to how far back you can go before you require a subscription to continue.
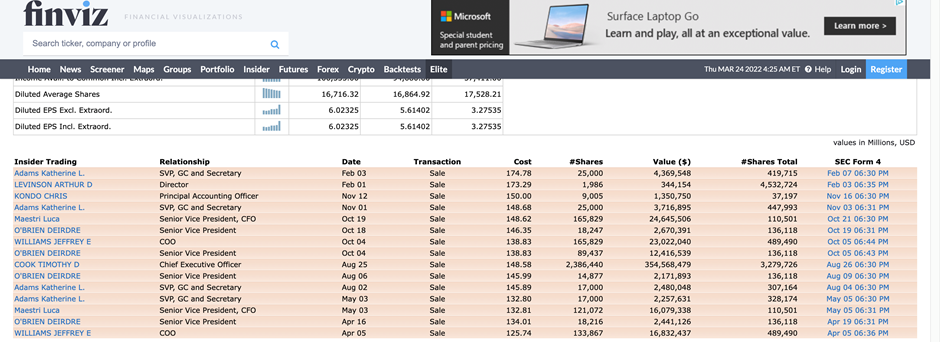
One pretty unique feature is the ability to view insider trading information. Under this section, you’re able to view certain insiders who have even bought or sold the stock, and the price it was bought or sold at.
Morningstar
Another great platform to use is Morningstar. This is a pretty popular platform that offers stock analysis and financial data.
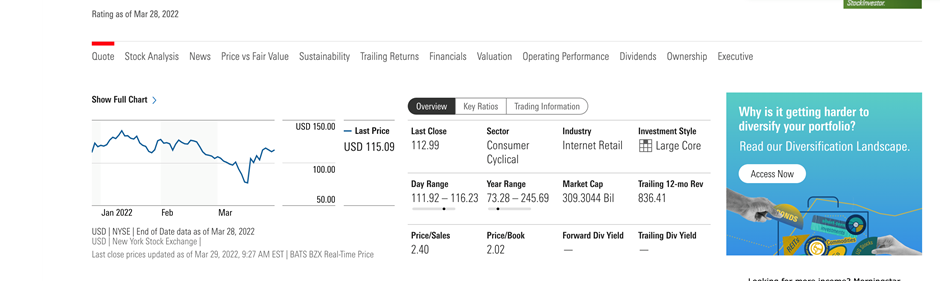
The website offers a plethora of options to choose from in its tab selections. Each tab provides a detailed evaluation in a specific area concerning the ticker.
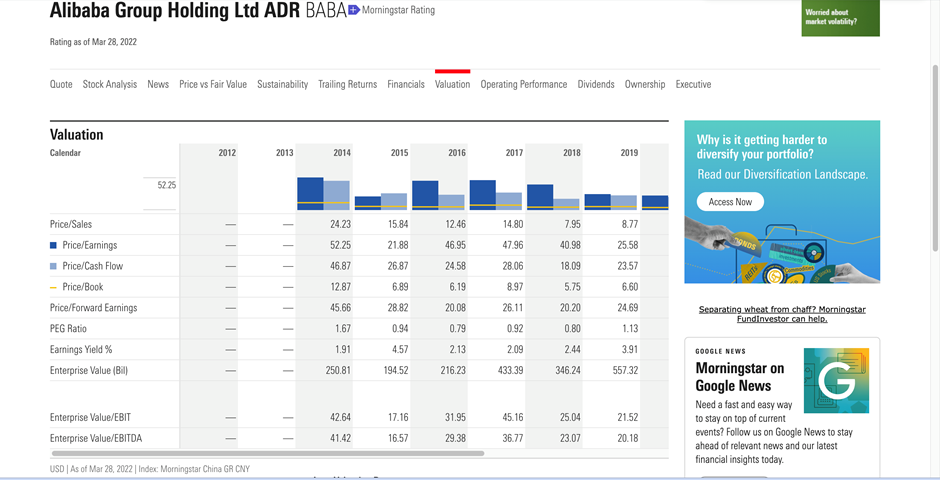
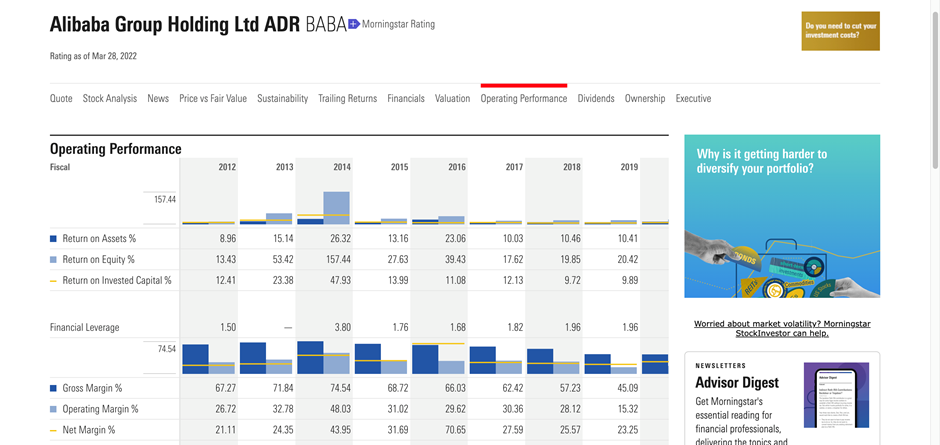
Each of these tabs is of great utility. As shown in the two examples above, the website offers detailed analyses of the company’s valuation and operating performance by consolidating relevant metrics over the past few years. For valuation, things like the PE ratio and PEG ratio are shown and compared against each other over a period of time. For operating performance, you’re able to analyze the company’s return on assets and equity, and also its relevant margins.
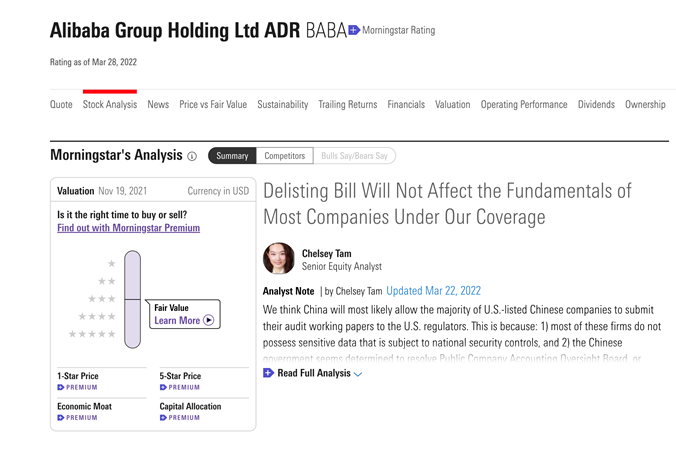
Morningstar also offers detailed stock analysis and analyst price targets. However, such functions require a premium subscription. All in all, while Morningstar is a great platform that offers very reliable financial data, many of its functions require a paid subscription, which may be off-putting for some users.
Tikr
Tikr is one of the best websites to analyze financial data. Its interface is extremely easy-to-use, and it provides a lot of information free of charge. A little drawback would be that you need to sign up to use its functions, but this is very well worth it considering the amount of data the platform provides, and how easy it is to retrieve it.
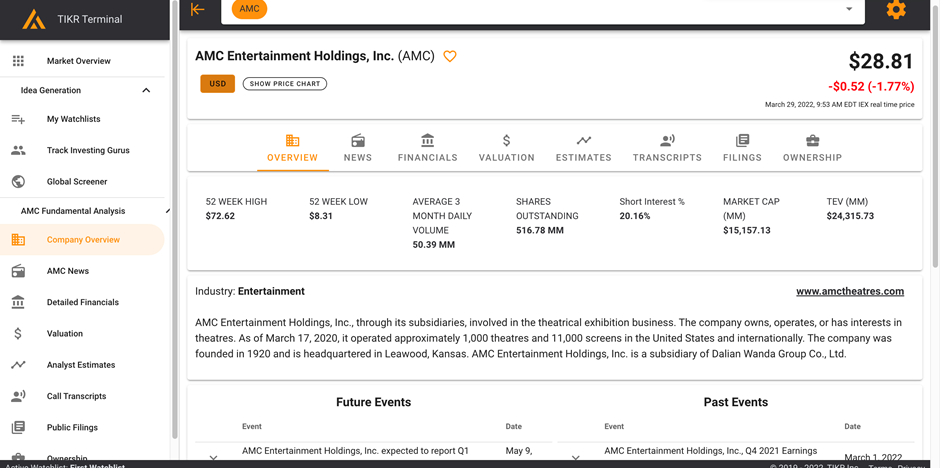
We start with an ‘Overview’ page, which gives a brief description of the company and some of its key financial metrics.
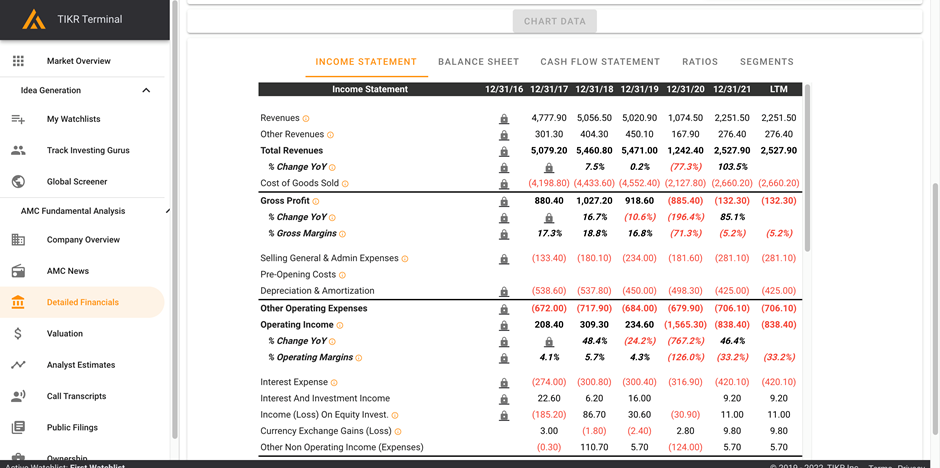
Now, heading over to financials, we can easily obtain any relevant financial statements for analysis. However, do note that data can only be backdated up to a certain year before a paid subscription is required.
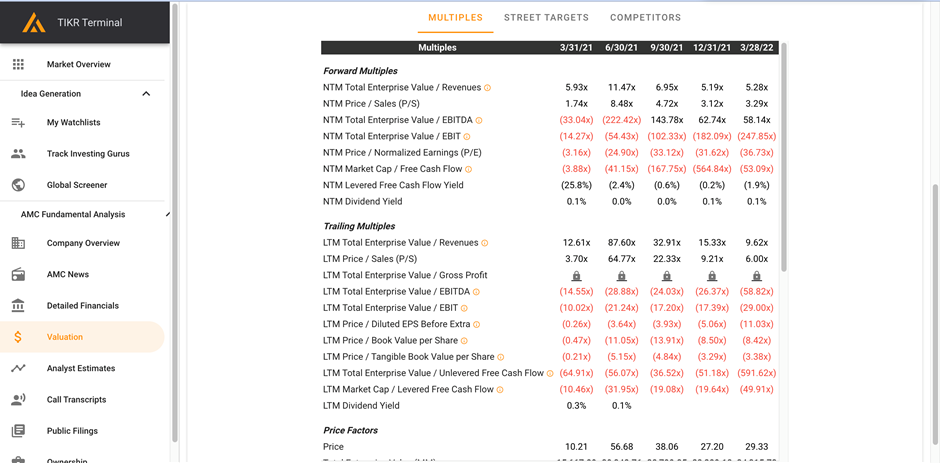
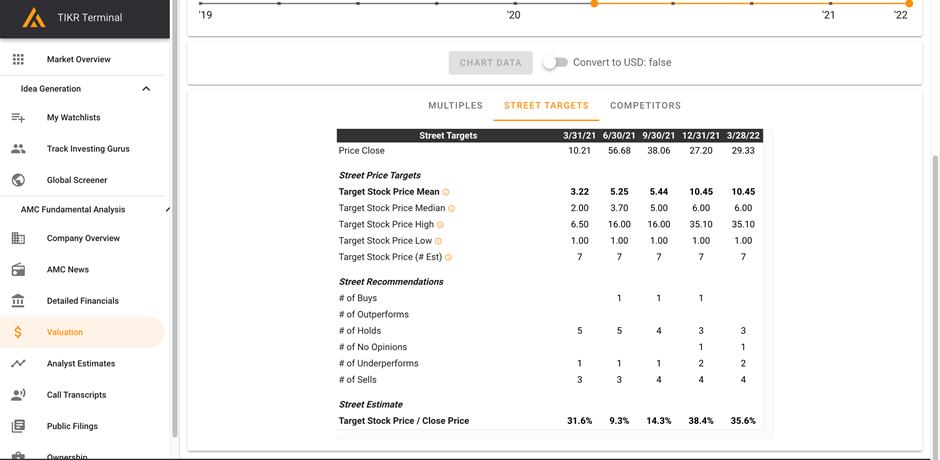
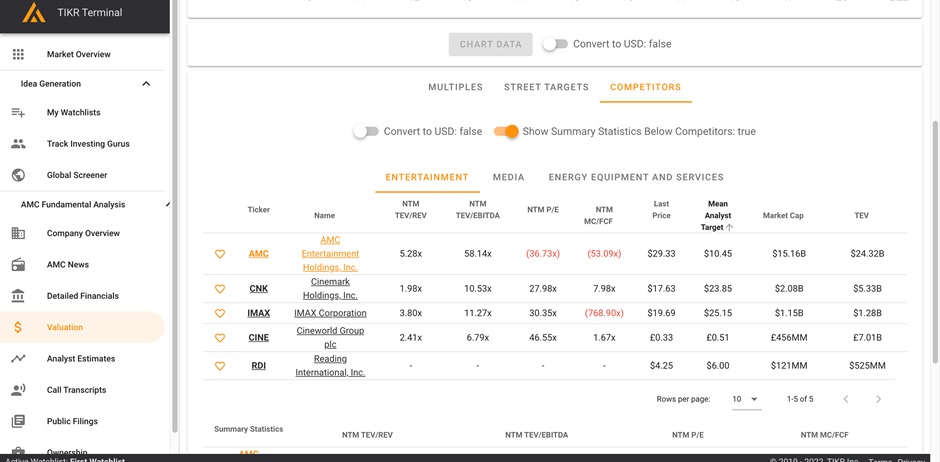
Under ‘Valuation’, there are three key tabs that can be used to assist you in estimating a fair valuation of the company stock. Firstly, ‘Multiples’ provides all relevant forward and trailing multiples. Next, ‘Street Targets’ show you a detailed price target analysis and also includes stock ratings by industry experts. Finally, ‘Competitors’ shows you a complete list of competing companies in the same industry. This is a good mix of very useful functions to help you evaluate a company’s valuation, and it’s certainly one of the most detailed ways to do so.
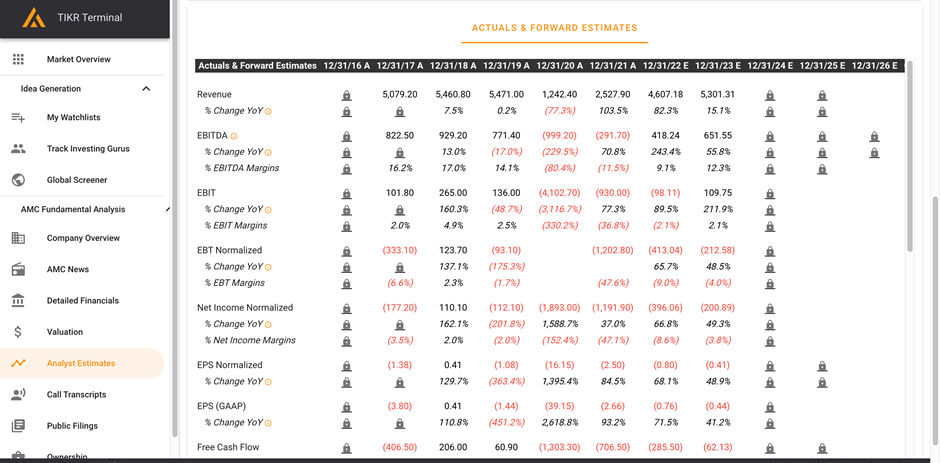
The ’Estimates’ tab shows you analyst estimates for various financial metrics like EPS, EBITDA, and net income. This is extremely helpful if you’re using a stock valuation model which involves any of these future projections. However, do note that after projecting over a certain number of years, any subsequent estimates will require a paid subscription. All in all, barring certain more advanced data, Tikr offers a wealth of free utilities to evaluate a company’s performance.
Quartr
For those who are interested to listen in to a recorded session of management’s investor calls for their quarterly result, one can download this app called Quartr which is a website that aims to provide recorded management sessions (typically for quarterly results) hassle-free to its users.
There is also no cost associated with using its feature. Do note that this service is available mainly for blue-chip US stocks (one can find the latest earnings transcript of Netflix in this app, a counter which we recently covered in this article)
Investor relations
If none of these sites provide data that are detailed or accurate enough for you, your best bet is to visit a company’s ‘Investor Relations’ page and obtain your desired numbers from the company itself. Most companies use this page to provide financial data to their investors, along with the company’s guidance and estimates.

For example, this is Foot Locker’s Investor Relations page. You can see that ‘Financial Information’ is one of the tabs situated at the top.

Under ‘Financial Information, you’re able to obtain SEC filings, annual reports, and quarterly results, all of which will give you full disclosure of any historical data which the company has released. Sometimes, it also comes along with the company’s estimates for its future growth.
I highly suggest using Investor Relations to carefully evaluate all of a company’s metrics before making an investment decision, especially if it’s going to take up a large proportion of your portfolio. While you may not be able to obtain stock price targets or estimates from external analysts, you can be certain that you’re getting every bit of fundamental data obtainable for that particular company.
But why does this information matter?
Well, many stock valuation models require the use of such ratios to estimate a fair valuation of a company’s share price. You can find out more information about such models over here. As a diligent investor, you must ensure that any long-term investment decision you make is backed up by good fundamental analysis, and it’s difficult to do this without historical data. As such, it’s good to be familiar with some of these platforms so you know exactly what you’re dealing with the next time you think about investing in a company.
If Tesla’s average price target is $1500 and the current price is $800, buying it is a no-brainer, right?
Wrong! Take note that price targets should never be taken as gospel, even when set by renowned institutions like Morgan Stanley. Remember that these figures are a gauge, but many things can change in the future. These institutions can easily change these price targets whenever new things happen, but you wouldn’t necessarily be able to deal with the monetary loss if things go south. It’s not possible to invest in something with a 100% certainty of making good returns, and analyst price targets certainly shouldn’t be your only basis for investing in a company. If you take a look at most growth stocks now, you’d realize that not many of them are trading near their price targets; most are trading considerably lower.
Why are some of the metrics different across different platforms?
Firstly, it’s good to note that different platforms obtain and process their data differently, so slight discrepancies can be expected. However, if there is a significant difference in a certain metric, it may be because you are confusing an annual report with a quarterly report. It could also be the currency that the financial report is in. If you’re evaluating a Chinese company, there’s a good chance that your metrics will be in terms of RMB or HKD, instead of USD. Do take note of this, and please be cautious and do not use the wrong metrics in your valuation models.
What’s the point of all this? Why can’t someone just tell me to buy or sell?
The harsh truth is that no one knows what’s going to happen in the stock market. Analysts, however qualified, can never tell you anything with absolute certainty. Fundamental data helps to guide your investment decisions through detailed calculations that reveal a company’s performance. They’re there to help you, but at the end of the day, buying or selling will always be your call. That’s just how the stock market works – there will always be risk involved.

Do Like Me on Facebook if you enjoy reading the various investment and personal finance articles at New Academy of Finance. I do post interesting articles on FB from time to time that might not be covered here in this website.
Join our Discord channel for an active discussion on all things finance!
Join our Instagram channel for more tidbits on all things finance!
Join our Youtube channel for short and sweet videos on all things finance!
SEE OUR OTHER WRITE-UPS
- Top websites and apps for free financial news
- How to double dividend yield using this simple strategy
- Top 5 Undervalued Small-Cap Singapore Dividend Stocks (>4% yield) (2021)
- Strong Dividend Growth Stocks Increasing Dividends by up to 19% in 2020
- 6 Blue-Chip Dividend Growth Stocks with High Dividend Growth Rate
- A list of “Best” Dividend Growth Stocks
Disclosure: The accuracy of the material found in this article cannot be guaranteed. Past performance is not an assurance of future results. This article is not to be construed as a recommendation to Buy or Sell any shares or derivative products and is solely for reference only.


