

In Part 1 of our analysis of how to buy REITs in Singapore, I introduced 10 Key Quantitative S-REIT filters to effectively and swiftly screen for REITs in Singapore that might be undervalued in terms of both operating fundamentals as well as price attractiveness.
Part 1: How to buy REITs in Singapore. 10-key S-REIT Quantitative Filter (Part 1)
In Part 2 of our analysis, we will be looking at 8 factors that are less quantitative by nature but an equally essential portion of the consideration process. The idea is to spend as little time as possible in identifying REITs that meet our quantitative criteria and instead to focus our attention on some of these specific non-quantitative that are often being overlooked.
Before we dive into Part 2 of our analysis, let’s just do a brief recap of the 10 key quantitative S-REIT filters we highlighted in Part 1. For those who have already read Part 1 of our analysis, feel free to jump straight to Part 2.
10 key Quantitative factors to consider when buying REITs in Singapore
The table below summarizes the 10 key criteria in our quantitative evaluation process
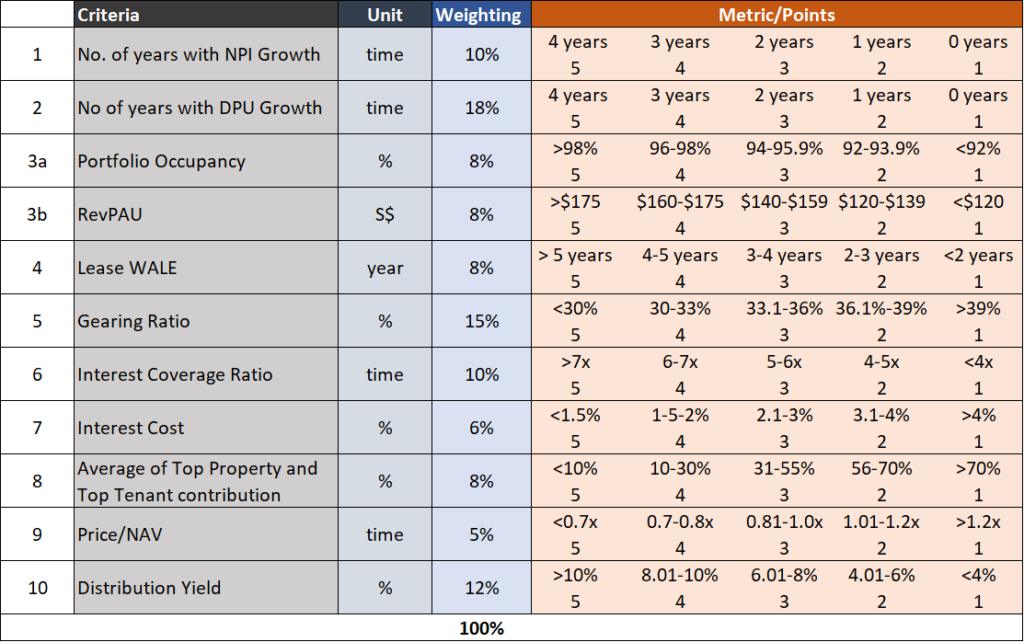
1.No. of Years with NPI growth
This is a key barometer to evaluate how well a REIT’s portfolio of properties is performing as well as the rise/fall in their associated property-related costs. A steady rising NPI growth every year illustrates the REIT’s ability to grow revenue, potentially organically by rental hikes which are a good sign.
For this metric, we associate a 10% weighting.
2.No. of Years with DPU growth
I like to see that NPI growth is ultimately translated into DPU growth. There can be occasions where the growth in a REIT’s revenue is not correspondingly accompanied by DPU growth. This could be due to higher finance-related costs or REIT manager’s fees.
For this metric, we associate an 18% weighting.
3.Portfolio Occupancy/Revenue per available room
A REIT with a high occupancy rate is desirable as that means it is fully maximizing its assets. In the next rental review, there is also a higher probability of positive rental reversion for properties that are at a high portfolio occupancy rate.
However, one should also take into consideration the rental reversion trend of a REIT. A REIT might be “artificially” keeping its portfolio occupancy low as they might wish to maintain their premium pricing compared to peers. We will be highlighting this factor of rental reversion in the next segment.
For this metric, we associate an 8% weighting. For the hospitality REITs, portfolio occupancy is replaced by Revenue per Available Room (RevPAU) as the evaluation criterion, with the same 8% weighting.
4.Portfolio WALE
A Portfolio’s WALE illustrates how long its properties are being leased out for. Generally, Singapore properties tend to have much shorter WALEs compared to their overseas counterparts. I do have a preference for portfolios with longer WALEs as it provides revenue visibility. Also, most of these long wale contracts have rental step-up, so there is an additional revenue growth element as well.
For this metric, we associate an 8% weighting.
5.Gearing ratio
A REIT’s gearing ratio is defined as its total borrowings divide by total assets, one of the most important metrics when evaluating a REIT, particularly in today’s context when there is the fear of a major global recession taking shape. A gearing ratio of less than 30% is considered very safe while those bothering at the 40% level might experience credit risk, particularly when portfolio asset values are heavily written down.
This might well happen in a global recession where companies go out of business, potentially depressing REIT’s occupancy/rental rates and correspondingly their associated property values.
For this metric, we associate a 15% weighting.
6.Interest coverage ratio
The interest coverage ratio measures the number of times its EBITDA can cover its interest expense. A high-interest coverage ratio might be able to help compensate for a higher gearing ratio, the latter possibly explained by low property valuation.
While not often the key focus when it comes to the leverage of a REIT, we believe that this factor should not be overlooked.
For this metric, we associate a 10% weighting.
7.Interest Cost
A REIT’s interest cost will demonstrate its ability to secure cheap funding. This generally ties back to the resilient-nature of the REIT’s properties. Typically, REITs with assets based overseas can secure a cheaper cost of debt as compared to those with Singapore-based assets (think negative interest rates in Europe, and likely soon in the US)
Cheaper refinancing cost is typically one of the key determinants of higher profitability for a REIT, given their leverage nature.
For this metric, we associate a 6% weighting.
8.Average of Top Property and Top Tenant Contribution
This metric will help us to mitigate concentration risk which might become increasingly important as we head into an economic recession. Diversification across property and tenants will ensure that a REIT is not heavily dependent on any one of its assets or key tenants.
We might want to do a second-level analysis on certain REITs such as Elite Commercial REIT, which has got a highly concentrated tenant base (99% of its portfolio is leased out to the UK government). However, there is less risk of the UK government defaulting on its payment (we assumed so) vs. a commercial entity.
For this metric, we associate an 8% weighting.
9.Price to NAV
This is often a metric used to evaluate how cheap a REIT might be trading relative to its assets’ market value.
In Singapore, we have got REITs trading as low as 0.15x Price to NAV (think the mighty Eagle) to as high as 1.58x (Parkway).
Typically, larger REITs and those with more stable operations tend to trade at a premium to their books. While we do favor REITs with a low Price/NAV vs. one with a higher Price/NAV, we do not place too much importance on this particular factor.
An alternative metric that we have not covered but could be of a higher level of importance is Price/distribution cash flow to unitholders. This is similar to Price/Cash Flow. We will talk more about this ratio in follow up articles.
For this metric, we associate a 5% weighting.
10.Distribution Yield
Last but not least, we have got the distribution yield of a REIT, a key factor in assessing the attractiveness of a REIT as an income-generating asset, Most of the time, we like a high distribution yield REIT counter vs. a lower one but that has to be evaluated alongside the sustainability of such dividend payments to assess if the REIT is indeed attractive on a yield basis.
More emphasis should be placed on the distribution yield of a REIT with a good DPU growth track record vs. one that has been consistently reducing their REIT payments.
As of this writing, there are about 11 REITs that pass our quantitative benchmark with a score of 3.5 or more (out of a maximum of 5 points).
These REITs are:
- Ascendas India Trust
- Ascendas REIT
- Ascott Residence Trust
- CapitaLand Commercial Trust
- CapitaLand Mall Trust
- Cromwell European REIT
- First REIT
- Frasers Logistics & Industrial Trust
- Keppel DC REIT
- Lendlease Global Commercial REIT
- SPH REIT
With that, let’s move on to Part 2 of our analysis.
How to buy REITs in Singapore. 8 additional factors to consider (Part 2)
In Part 2, we look at 8 less quantitative factors. These are:
- Benefits of a strong sponsor
- Sustainability of DPU growth/DPU support
- REIT managers remuneration scheme
- Rental reversion trend
- Frequency of equity raising vs. asset recycling
- Access to cash and line of credit facilities/unencumbered properties
- Tenants profile
- Specific industry outlook
Let’s look at them one by one.
Key Factor # 1: Benefits of a strong sponsor
A strong REIT sponsor is often under-rated but it should be part of the evaluation process when looking at purchasing REITs. REITs that are backed by strong sponsors/parents who are property developers with excellent credit ratings are often seen as more attractive vs. those whose sponsors are facing credit-related risks.
For example, Mapletree-Group of REITs has likely benefitted from Mapletree’s excellent credit rating. Other REITs that have strong sponsors include Keppel-Group of REITs and CapitaLand-Group of REITs.
On the other hand, the First REIT saga illustrates that a sponsor with a weak reputation can hurt the REIT itself. First REIT’s share price collapsed back in late 2018 when its main revenue contributor (concentration risk) and sponsor, Lippo Karawaci saw its credit ratings being downgraded by Fitch from B to CCC+ over concerns about its liquidity risks as well as alleged bribery linked to one of the Lippo Group’s asset.
Hence, despite First REIT ranking relatively well in our quantitative factor scoring with a score of 3.8 at present, I will likely give it a miss after taking into consideration its sponsor factor, despite also operating in a relatively recession-proof healthcare sector.
A strong sponsor will also encompass a strong pipeline of assets for future growth. A strong sponsor can give REIT access to valuable assets through a robust pipeline of quality asset injections. REITs are not obligated to purchase these assets from their sponsors but will usually have first rights of refusal. This serves as a ready source of inorganic growth for the REIT.
Last but not least, a strong sponsor, such as a reputed property developer, will provide a certain level of corporate governance assurance and financial backing for the REIT in the event of a crisis.
Key Factor # 2: Sustainability of DPU growth/DPU support
We talked about DPU growth as one of our quantitative metrics, one of which we placed significant importance on. We quantify it by looking at the number of years a REIT has demonstrated DPU growth on a YoY basis.
Given its importance, it is also important to evaluate how might DPU growth/decline materialize in the future. This can be through a few manners:
- Yield accretive inorganic acquisition. This means that despite the higher share base (due to rights issuance), the overall yield on a DPU basis can still grow if yield accretive assets were being acquired.
- Positive Asset Enhancement Initiatives. REITs will engage in asset enhancement initiatives or AEI for short on their properties from time to time. These AEIs, if done well, will translate to an ability to charge higher rental rates to tenants. Look out for properties that might be currently doing major AEI works on their key properties. This might hurt DPU in the short-term but could result in DPU growth upside in the medium and long-term.
- Reduction in interest costs: Given that REITs are highly levered assets, a reduction in interest costs on borrowings will have a relatively significant positive impact on their profitability and consequently distributable income.
- Increase in Managers’ fees payable in units: For REITs who are not fully paying their management fees in units, they can have the flexibility to increase management fees in units to reduce outright cash cost. For example, Capitaland Commercial Trust’s management fees are fully paid in cash instead of units. If the business sees a dip in today’s context, the REIT can choose to partially or fully convert to unit payments. This will conserve cash and ensure that the REIT can continue to grow its DPU.
- Loss of DPU Support: One often overlooked area is DPU support from the sponsor or significant shareholder. In the first few years of listing, the strategic investors might not be eligible to take dividend distributions (this information can be found in the prospectus). This increases the overall pool of distributable income to minority shareholders. However, once that lock-up period has lapsed, one will realize that there will be a sudden and huge decline in distributable income to minority unitholders.


BHG Retail REIT is such an example. In the first year of its listing, 30% of unitholders (strategic investors) are not entitled to any distributions. By the 5th year, this ratio declines to 5%.
Key Factor # 3: REIT managers remuneration scheme
We will want to see that a REIT manager’s remuneration is aligned with that of unitholders. As a unitholder, we will want to see that the REIT manager is fairly compensated and NOT overly compensated.
If DPU has been growing consistently, it is fair that a REIT manager’s fees grow at a rate following that of DPU growth. If management fees are growing at a rate excessively more than the rate of DPU growth, then we might have a problem of “over-compensation”.
This can happen because performance fees for REITs can be calculated based on Gross Revenue and NPI growth. Recall we highlight that NPI of a REIT can be growing but that does not necessarily translate to a corresponding DPU growth due to a variety of factors such as management fees and finance cost etc.
Hence, in a situation where the performance fee of a REIT is not pegged to DPU growth but instead to gross revenue or NPI, then there might be a conflict of interest.
I have written in this article: Are you overpaying your REIT manager? Which S-REITs have the “highest” management fees, detailing the components of a REIT manager fee (1. Base fee and 2. Performance fee) as well as the payment structure of S-REIT managers.
Most of the REITs have a manager payment schedule where asset management fees as a percentage of distributable income from operations (based on 2019) fall within the 10-15% band. There are some outliers which we might want to avoid if fees start crossing significantly beyond the 15% ratio.
Those that pay management fees in cash (100%), counters such as CapitaLand Commercial Trust, Keppel DC REIT, Parkway Life REIT, CapitaLand Mall Trust, etc have the flexibility to convert management fees payment partially/fully to units to maintain their DPU growth trend.
To summarize, we can and should track a REIT’s DPU growth trend relative to manager fees growth trend to see if a REIT manager’s interest is aligned with that of unitholders.
Key Factor # 4: Rental reversion trend
The rental reversion trend is one of the key metrics that most will analyze when forecasting revenue growth.
However, the problem is that rent reversion is not standardized across the industry. A +5% rental reversion by Keppel REIT, for example, is different from a +5% rental reversion by Frasers Commercial Trust.
The BusinessTimes, back in early 2017, highlighted this issue in an article: REITs must be consistent in how they compute rental reversions.
The article highlighted the varying methods in which REITs used when disclosing their rental reversion percentage.
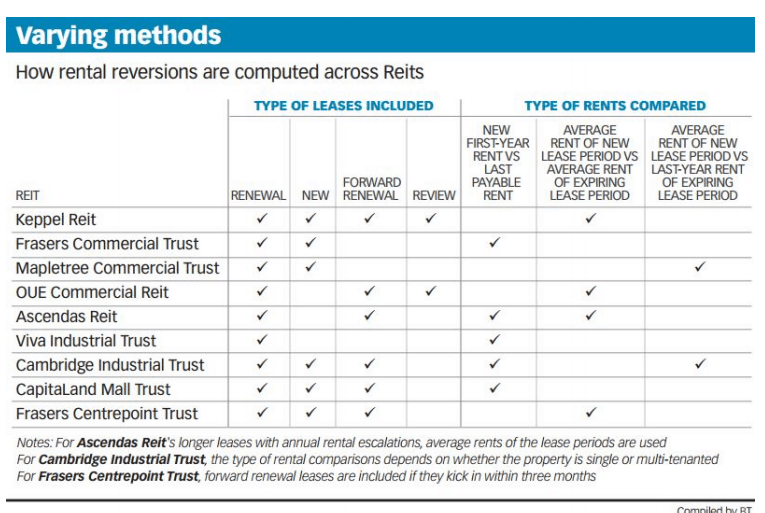
For Keppel REIT, the way it calculates rent reversion, based on average rent of new lease period vs average rent of expiring lease period, might be a LESS conservative method compared to Mapletree Commercial Trust which uses the average rent of new lease period vs. LAST YEAR rent of expiring lease period, in a rising rent environment.
The most conservative manner I feel is when you compare the new first-year rent vs. last payable rent. This method is adopted by Frasers Commercial Trust for example. You can immediately see how the actual cash flow will be impacted. Using the average rental of new lease period will essentially “overstate” the income statement relative to cash flow as the “higher” average rental is not yet realized as cash flow.
Take for example a 3-years lease with the lease amount of $10 in the first year, $10.50 in the second year and S$11 in the third year. The previous 3-years lease was at $8.50, $9.00 and $9.50 per annum respectively.
Using the method of new first-year rent vs. last payable rent, the rental reversion would be ($10-$9.50)/$9.50 = 5.3%
The second method of comparing average rent of new period and an average rent of the old period, the rental reversion would be ($10.50-$$9.00)/$9.00 = 16.7%
The third method of comparing average rent of new period vs. last payable rent, the rental reversion would be ($10.50-$9.50)/$9.50 = 10.5%.
Same rental increment amount but seemingly different rental reversion conclusion.
A portfolio where a 5% rental reversion occurs might not translate to a 5% increase in gross revenue on a YoY basis. That figure might be way lower in some cases. Hence it will be useful to dig a little deeper into the rental reversion methodology of your REITs.
Rental reversion should be taken in context with the portfolio occupancy rate. A strong rental reversion trend can be an offsetting factor for a low occupancy rate. Similarly, a weak rental reversion trend can negatively offset the high occupancy rate.
Ascendas REIT, which has a relatively low occupancy rate for its Singapore properties, exhibit strong rental reversion trends (although they use Method 2 in the computation). The strong rental reversion trend can be taken into consideration to help offset its low SG property occupancy rate. Ascendas REIT can well-afford to lower its rental asking price to “fill-up” its properties to a higher occupancy level if it so wishes to.
Key Factor # 5: Frequency of equity raising vs. asset recycling
Given that S-REITs are mandated to payout 90% of their taxable income each year in the form of distributions, most REITs do not have spare capital to deploy when it comes to making new acquisitions. Hence they tend to turn to the capital market in the form of equity raising (rights) to raise new capital for new asset acquisitions. This will result in a higher outstanding share base and if distribution income did not increase correspondingly, that will result in an overall decline in DPU.
I tend to favor REITs that can grow their income organically through AEIs, cost-management, etc vs. one that constantly turns to the capital market for equity to grow through inorganic means. Given that the base fee of a REIT manager’s compensation schedule is tied to its asset base, there is an incentive on the part of the REIT manager to acquire new properties, sometimes at the detriment of unitholders.
On the other hand, there is less incentive for a REIT manager to divest their assets as such an action will reduce the overall asset under management (and their recurring base fee). A good REIT manager will look at constantly recycling their portfolio of assets, divesting assets with lower-than-average capitalization rates vs. similar properties while concurrently using the proceeds to acquire yield-accretive assets. In this manner, the REIT does not need to turn to the capital market to raise funds.
For example, Keppel REIT, in late 2019, divested Bugis Junction Towers for S$547.5m, realizing capital gains of S$378.1m, with the proceeds providing the company with the financial flexibility to engage in the buyback, acquisitions, debt reduction and distributions to unitholders.
Unfortunately, the company did not fare well in our quantitative screening process, with a score of only 3.04. This is due to inconsistency in its NPI as well as DPU. We also note that Keppel REIT has an extremely high management fee ratio of 25%. Seems like the REIT manager is “overpaying” themselves.
Key Factor # 6: Access to cash and line of credit facilities/unencumbered properties
While a REIT’s gearing profile gives us a quick overview of its leverage situation, it is always useful to note the REIT’s outstanding access to cash and line of credit facilities provided by its bankers.
A REIT with a “decent” level of gearing, say 35% might be at a high risk of running into funding issues in today’s context if they have got ZERO access to an additional line of credit facilities. Ascendas REIT (gearing of 35.1%) for example has got approx. $1.2bn outstanding credit facilities available for it to drawdown. This is roughly 25% of its current total debt.
If insufficient, Ascendas REIT unencumbered properties as a percentage of total investment properties is at a high 91.8%. This provides it with the added financial flexibility to tap on secured borrowings, if required, ahead.

On the other hand, a REIT like ESR-REIT has one of the highest (if not the highest) gearing profile within the S-REIT community at 41.5% (as of end-2019) and while it still has 195m in debt headroom before hitting the 45% mandatory ceiling set by MAS, it only has undrawn committed facilities of $90m left as at end-2019.
In today’s context where “Cash is King”, a REIT with a huge cash buffer will likely increase its chance of survival.
Key Factor # 7: Tenants Profile
We rated diversification of tenants and asset as one of our Top 10 key quantitative metrics earlier on in Part 1 of our analysis. However, we also did highlight that one should do a level 2 analysis, evaluating the asset/tenant profile on a more in-depth basis.
Bankruptcy risk is getting increasingly real in today’s context, with COVID-19 forcing businesses worldwide to shut-down. Although Singapore has yet to mandate a country-wide lockdown (which will essentially mean the closure of most properties), the risk of such a scenario materializing remains.
Businesses without access to cash or with cash-flow problems might find themselves at risk of insolvency and this will, in turn, create a vicious loop, impacting property owners that lease the property space to them (risk of tenant defaults and low future portfolio occupancy).
A REIT that has significant concentration risks in terms of assets/tenants will find themselves vulnerable to an economic recession.
However, we did also highlight that in certain unique scenarios, a highly concentrated portfolio comprising of one or two key assets/tenants might not be as bad as it seems. We highlighted Elite Commercial Trust as an example.
Personally, any single tenant that encompass at least 10% of the REIT’s revenue should be scrutinized for potential default/loss on departure due to both systematic risks as well as industry-specific risk. For example, a REIT might have significant exposure to the Oil & Gas industry with a sizable portion of its units leased out to O&G clients. The recent oil price collapse might once again (happened back in 2014-2015) put O&G counters at risk of insolvency and potential default of their rental payments.
Key Factor # 8: Specific Industry Outlook
While COVID-19 is likely to impact the SG economy on all front, with no single industry likely being spared, some will be more significantly impacted than others.
For one, the hospitality industry will see a huge negative impact from the COVID-19 fallout and if one wishes to “bottom-fish” a REIT in this industry, balance sheet strength and access to capital will be the utmost importance. It might be many more months or quarters before we see the tourism industry back to normal, with travelers filling up hotel rooms.
On the other hand, suburban mall REITs such as Frasers Centrepoint Point is seen as more resilient amid COVID-19 (although its share price has been heavily sold-off the past 2-3 trading days). A weekend trip to heartland malls such as Waterway Point seems to indicate that business is “back to usual”. While no one can guarantee if the “worst is over” in Singapore (likely not), I believe Frasers Centrepoint Trust is fundamentally more resilient compared to a high-end mall such as Starhill Global REIT which is highly dependent on tourist footfall.
REITAS frequently provides research outlook on the various S-REIT industries, using sources from Savills and Colliers. The market outlook that Colliers did back in Jan 2020 favors office and hotel assets on favorable supply-demand dynamics and drivers. This is before the COVID-19 situation starts to deteriorate.
The next quarter outlook will be significantly different.
Conclusion
In Part 1 of our analysis on how to buy REITs in Singapore, I introduced 10 quantitative measures to screen out potential undervalued REITs for further evaluation. I use a simple scoring mechanism to rate the REITs, with those above 3.5 points (max of 5 points) eligible for the second round of evaluation. This is meant to quickly and efficiently screen out the “best” REITs for consideration.
While we do acknowledge that even a “bad” REIT counter has its fair value and it might make sense to purchase it if the margin of safety (the difference between market price and fair value) is sufficiently huge, it is difficult and often a subjective manner when it comes to putting a “price-tag” on a stock counter.
For the normal layman, it is better to stick with the “best-in-class” in today’s environment through a screening process like what we have introduced.
In Part 2 of our analysis, we expanded on the evaluation scope by introducing less quantitative measures such as sponsors brand/profile and future growth pipeline, access to credit line facilities, frequency of equity raising, industry outlook, etc. The time taken to evaluate REITs in Part 2 is considerably much longer.
By combining both Part 1 and Part 2, I hope to present a simple and easily understandable solution on the process one might take in considering which REITs in Singapore to buy.
Do note that these criteria are never “fixed in stone” and if you do have a better criterion in evaluating REITs, do share with us in the comment section.

Do Like Me on Facebook if you enjoy reading the various investment and personal finance articles at New Academy of Finance. I do post interesting articles on FB from time to time which might not be covered here in this website.
Join our Telegram broadcast: https://t.me/gemcomm
SEE OUR OTHER WRITE-UPS
- HOW TO BUY REITS IN SINGAPORE. 10-KEY S-REIT QUANTITATIVE FILTER (PART 1)
- WHICH ARE THE BEST TAX-EFFICIENT ETFS TO INVEST IN?
- ARE YOU OVERPAYING YOUR REIT MANAGER? WHICH S-REITS HAVE THE “HIGHEST” MANAGEMENT FEES?
- WHICH S-REITS HAVE THE BEST RECORD OF DIVIDEND GROWTH?
- 10 GREAT REASONS FOR REITS INCLUSION IN YOUR PORTFOLIO AND 3 REASONS TO BE CAUTIOUS
- WHY I AM STILL BUYING REITS EVEN WHEN THEY LOOK EXPENSIVE
Disclosure: The accuracy of the material found in this article cannot be guaranteed. Past performance is not an assurance of future results. This article is not to be construed as a recommendation to Buy or Sell any shares or derivative products and is solely for reference only.


5 thoughts on “How to buy REITs in Singapore. 8 additional factors to consider (Part 2)”
Well thought article and good insights. Thanks for sharing 👍
Hi Vivian,
Thanks for stopping by.
Very well presented and good information you have to digest.
hey darren, thanks for stopping by
Quality articles written on how to analyse REITs. Thank you!