
Blue-Chip SG REITs to buy and hedge against Inflation?
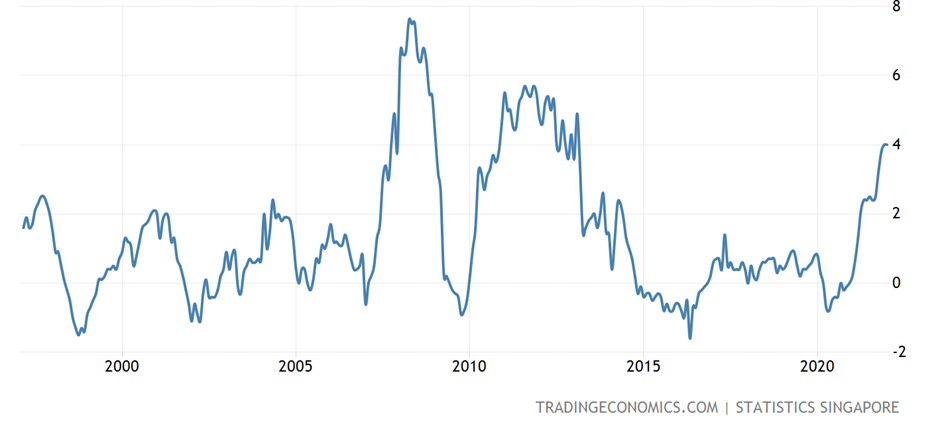
Everything is getting more expensive. Singapore’s reported inflation rate for January rose 4.0% year over year. That is a 10 year high! Singapore’s inflation rate for February is likely to skyrocket due to the Ukraine / Russia crisis and the inflation rate is forecasted to stay high in the upcoming months, in line with the global inflationary scenario.
Just last evening, Fed chairman Jerome Powell admitted that “inflation is much too high” and that the Fed will take necessary steps to raise interest rates aggressively if needed.
How can ordinary Singaporeans protect themselves from rising prices? One way to do so is through real estate. Real estate is an asset class that offers some form of protection during inflationary periods as hard assets are favored in an inflationary environment. Well, at least the world’s richest man, Elon Musk, seems to think so. Do take his words with a pinch of salt though, since, in May 2020, he said he would “own no house”.
Owning real estate through REITs
An easy way to gain exposure to real estate without using much capital is through the purchase of REITs.
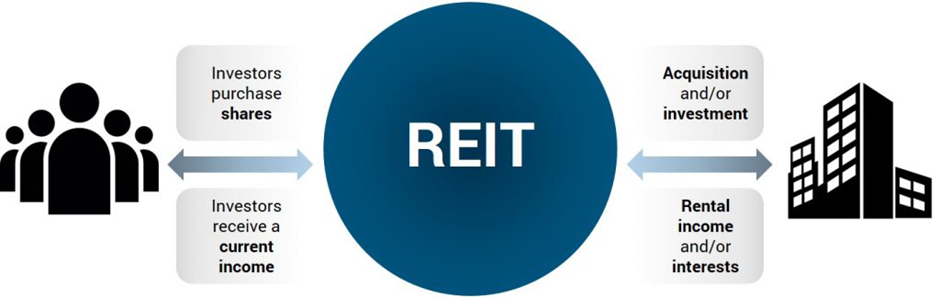
A REIT (Real estate investment trust) is a company that owns, operates, or finances income-generating properties such as industrial buildings, offices, residential apartments, shopping malls, and even healthcare facilities. You can find out more about REITs in a previously written article here: Ultimate Guide to REITs in Singapore
Given how we are entering an inflationary period, I think it might be prudent to hedge your portfolio with some income-generating SG REITs.
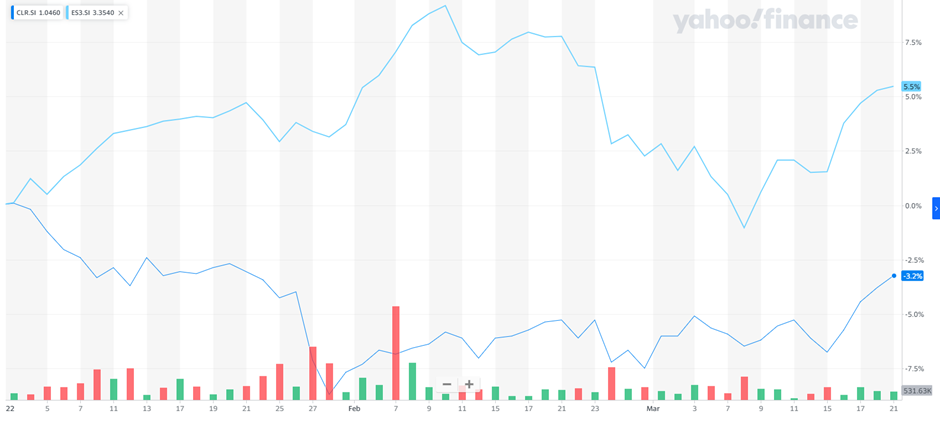
How have SG REITs done so far on a YTD basis? Well, the Lion-Phillip S-REIT ETF, an ETF that tracks a broad basket of SG REITs, is down ~3.2% so far. Compare that to STI which is up ~5.5% YTD, SG REITs are underperforming the broad SG market by roughly ~9%! Is there an opportunity in this current drawdown of SG REITs?
Some risks to note
It is important to remember that REITs are hurt by higher interest rates and recessions. Higher interest rates make a REIT’s cost of financing its operations aka bank borrowings, more expensive and a recession hurts the REIT’s tenants which might cause them to be unable to pay their rent which causes a REIT’s revenue and earnings to be negatively impacted.
Using the checklist of 10 key qualitative metrics in evaluating a REIT’s attractiveness, which I wrote previously in this 2-parts article, I evaluated 2 Blue-Chip SG REITs based on their business fundamentals. Are their current fundamentals and valuation “enticing” enough for one to take up a position in the counters?
As a reminder, my 10 key qualitative metrics are the following:
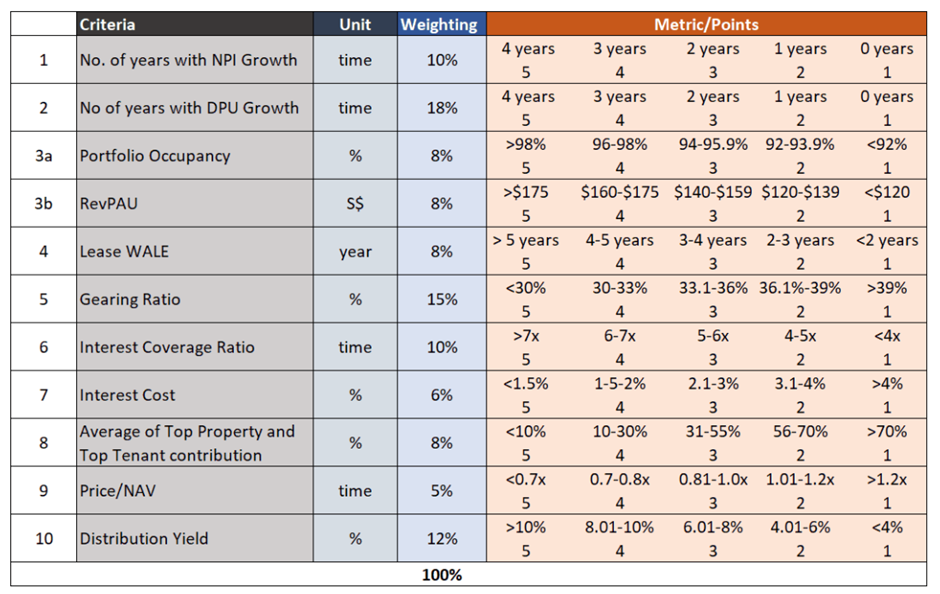
More information can be gleaned from a previously written article: How to buy REITs in Singapore. 10 key S-REIT quantitative filter
By applying this checklist, I evaluated 2 Blue-Chip SG REITs that might be good candidates to hedge against the effect of inflation.
Blue-Chip SG REIT #1: Ascendas REIT (A17U)
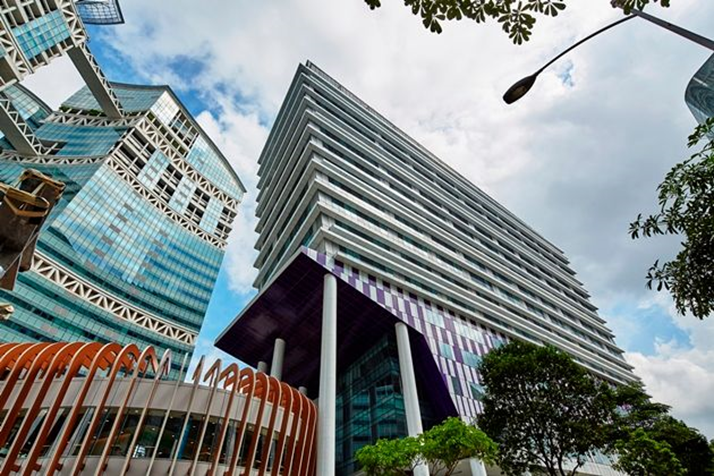
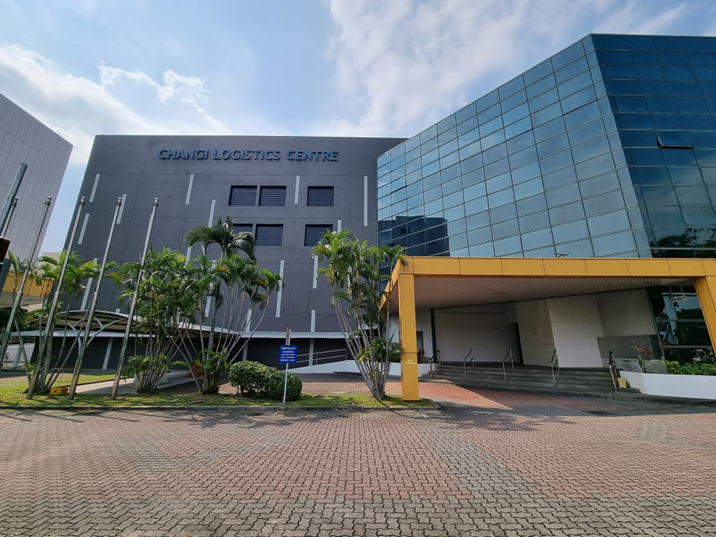
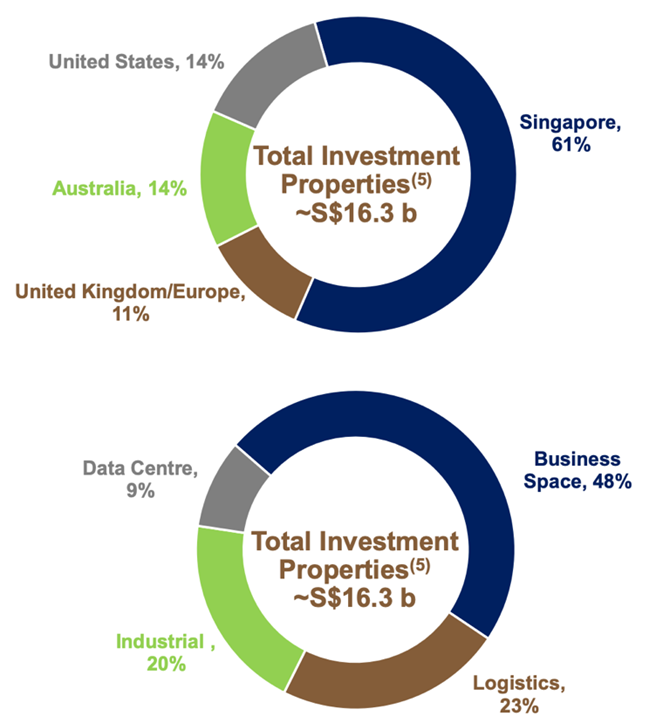
Ascendas REIT is the largest industrial REIT in Singapore with $16+ billion assets under management. It has a well-diversified portfolio of properties in different industries. It has operations in 4 continents: the US, Australia, UK / EU, and Singapore with its main core of operations based in Singapore. Some of its Singapore properties include: Galaxis at One North, Courts Megastore, and Changi Logistics Centre

How does Ascendas REIT fare against the 10 key metrics?
Metric #1: No. of years with NPI Growth

Ascendas does well in this category, increasing its NPI for 4 consecutive years including during the pandemic. Hence, 5 points will be given.
Metric #2: No. of years with DPU Growth

Ascendas does not fare that well in this category as its DPU declined from 2019 to 2020. However, I would not penalize the REIT too much for this as it was during the height of the pandemic and the REIT was disproportionately affected by it. It appears to be back on its long-term track record of increasing its payout as seen from the increase from 2020 to 2021. Hence, 4 points will be given.
Metric #3: Portfolio Occupancy / Revenue per available room
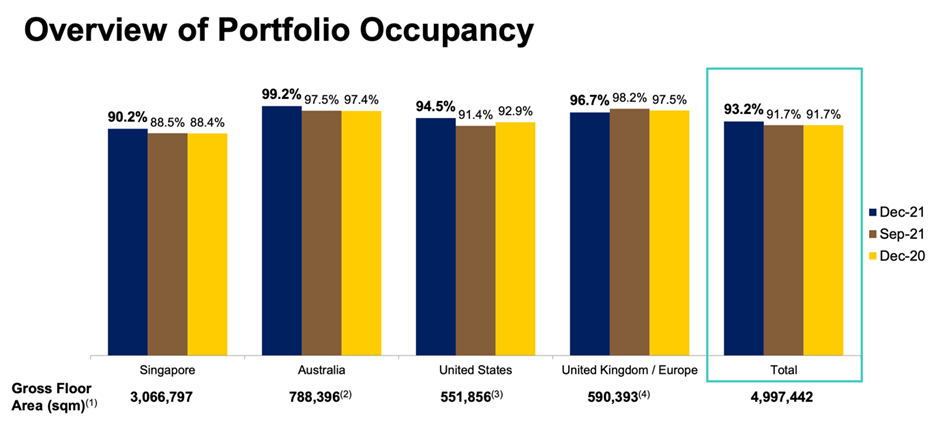
Ascendas’ overall portfolio occupancy rate is 93.2% as of 31 Dec 2021. It is rather weak; hence it gets 2 points here. However, we have to take into account the positive rental reversion in the low single-digit range as guided by management for FY22.
Metric #4: Portfolio Weighted Average Lease Expiry
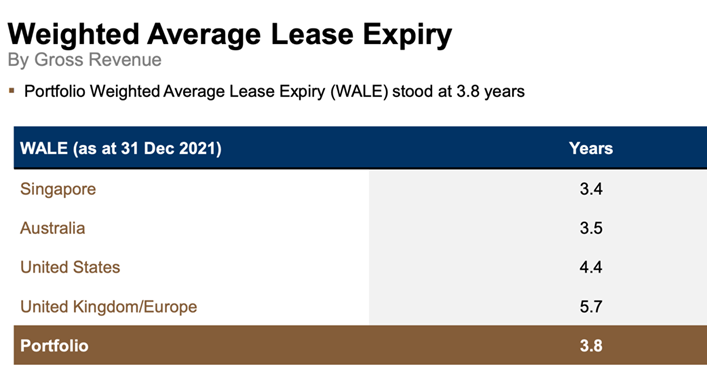
Singapore’s properties usually have shorter WALEs than overseas properties. Long WALEs usually have an inflationary clause built into the contracts that ensure rentals will be increased over time. Ascendas REIT has an overall WALE of 3.8 years as of 31 December 2021. Hence, it scores 3 points here.
Metric #5: Gearing Ratio
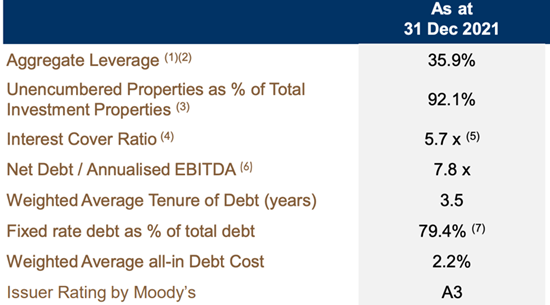
Ascendas REIT has a healthy gearing ratio of 35.9%. It means the REIT is not taking on too much leverage. It scores 3 here.
Metric #6: Interest Coverage Ratio

Ascendas REIT has an interest coverage ratio of 5.7x which is roughly the average. It means that Ascendas EBITDA can cover its interest charge by 5.7x. It is relatively healthy. Hence it gets 3 points.
Metric #7: Interest Cost
Ascendas REIT has an average cost of debt of 2.2%. Fixed-rate debt consists of a significant portion (79.4%) of its total debt. This is slightly above the industry average of 75.1%. This ensures that Ascendas would not be too badly affected by rising interest rates compared to its peers. It scores 3 points here.
Metric #8: Average of Top Property & Top Tenant Contribution
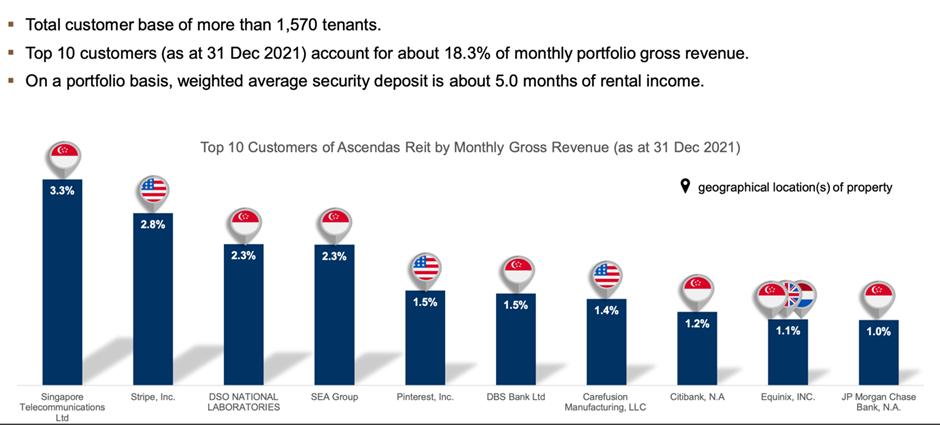
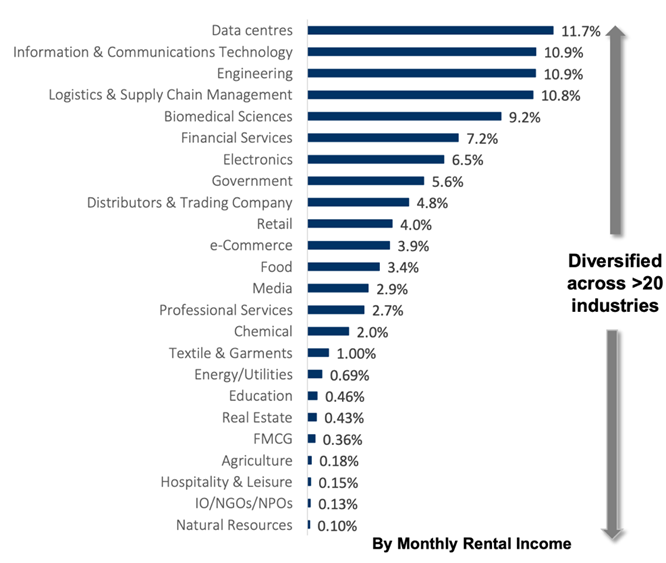
Ascendas is well-diversified with the highest contributor of income only at 3.3%. It scores a 5 here. This is important as Ascendas has some sturdy tenants such as Singtel, DSO National Laboratories, and Equinix that would be fine with paying higher rents during inflationary periods. The wide diversification of tenants also ensures stability as Ascendas is not dependent on one particular industry which might come under pressure during a recession.
Metric #9: Price to NAV
Ascendas has a current NAV of $2.38. It is currently trading for $2.82 so it has a Price to NAV of 1.19. It is trading at a discount to its full-year average historical price/nav of 1.272. However, it is still valued at a premium compared to an industry average of 1.057. It gets a 2 here.
Metric #10: Distribution Yield
Ascendas has a current distribution yield of 5.041% based on its dividend for its latest full-year results. Given Ascendas’s long history of increasing its NPI and DPU, this distribution yield is likely to be sustainable going forward. It scores a 2 here.
Overall Score for Ascendas REIT based on the scoring system
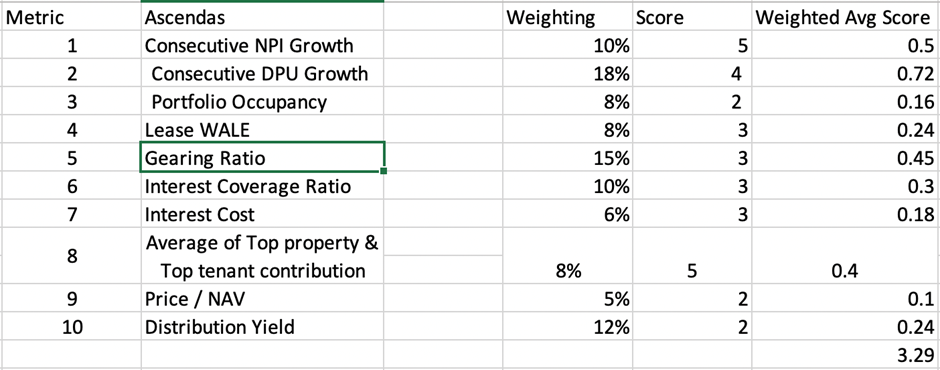
Even though its total weighted average score of 3.29 is slightly lower than our consideration list of 3.50, I would argue that it is worth starting a position in Ascendas REIT at these levels as it is a premium blue-chip REIT that hardly ever trades near such levels. If, however, you already have ownership of the REIT, I would just hold and start accumulating more units at the price range of 2.50-2.60 if the REIT continues to sell-off. I am looking to start a position in Ascendas REIT at this price level and will add on it if it continues to sell off.
Blue-Chip SG REIT #2: CapitaLand Integrated Commercial Trust (CICT: C38U)
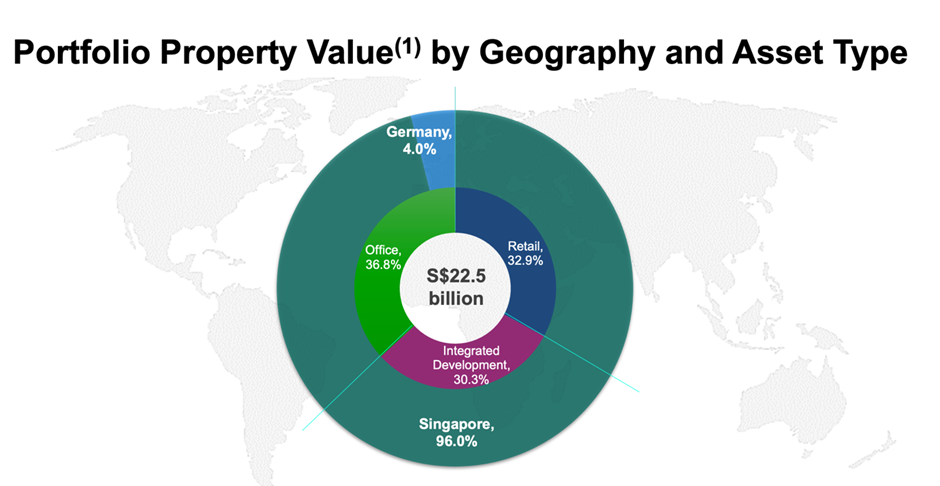
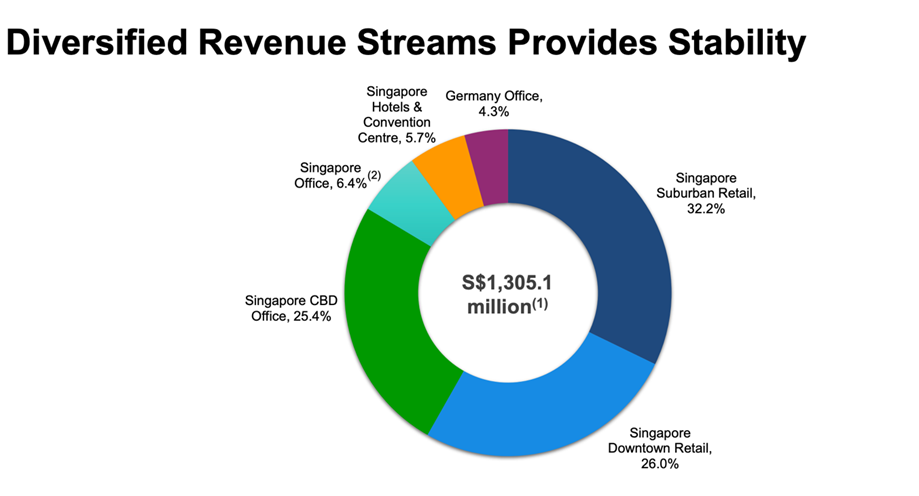
CICT is the oldest and largest REIT listed on SGX with $22.5 billion in assets under management as of 31 December 2021. It is the combined entity of CapitaLand Mall Trust (CMT) and CapitaLand Commercial Trust (CCT) after the two merged in November 2020. It has a well-diversified property portfolio that consists of mainly commercial assets (retail and/or office).
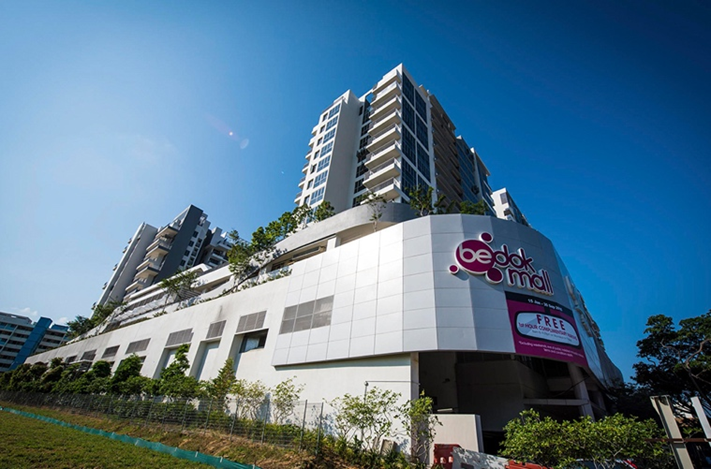
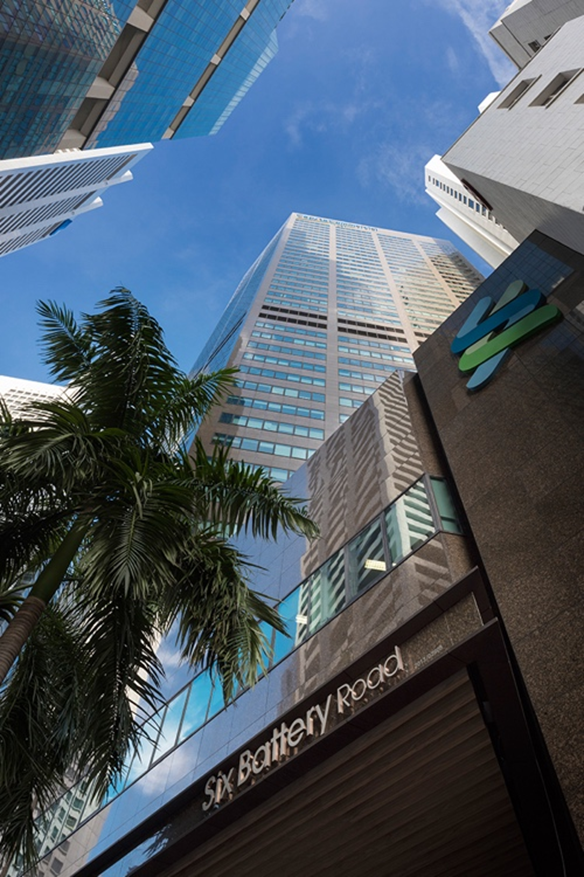
Its main base of operations is in Singapore with 2 properties located in Frankfurt Germany. Recently, it is looking to expand into Australia by procuring 2 office buildings and a 50% interest in an integrated development. It is the REIT you want to own if you would like to have exposure to Singapore’s real estate scene. Some of its iconic Singapore properties include Plaza Singapura, Bedok Mall, and Six Battery Road.

How did CICT fare against the 10 metrics?
Metric #1: No. of years with NPI Growth:

CICT does relatively okay in this category, increasing its NPI from 2017 to 2019 and 2020 to 2021. It should be noted that the drastic decrease from 2019 to 2020 was due to the pandemic. CICT is adversely affected by lockdowns due to its huge exposure to retail and office properties. Hence, 4 points will be given.
Metric #2: No. of years with DPU Growth

CICT does not fare well in this category as its DPU declined from 2019 to 2020. However, I would not penalize the REIT too much for this as it was during the height of the pandemic and the REIT was disproportionately affected by it. It appears to be back on its long-term track record of increasing its payout as seen from the increase from 2020 – 2021. Hence, 4 points will be given.
Metric #3: Portfolio Occupancy / Revenue per available room
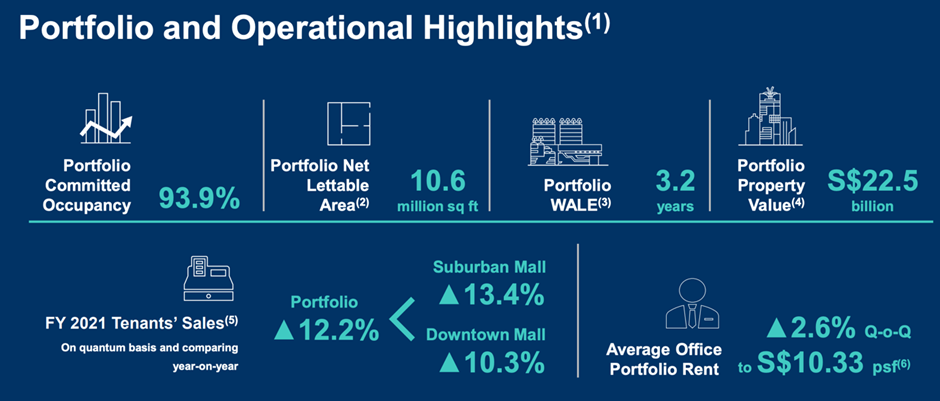
CICT’s overall portfolio occupancy rate is 93.9% as of 31 Dec 2021. It is rather weak; hence it gets 2 points here.
Metric #4: Portfolio Weighted Average Lease Expiry
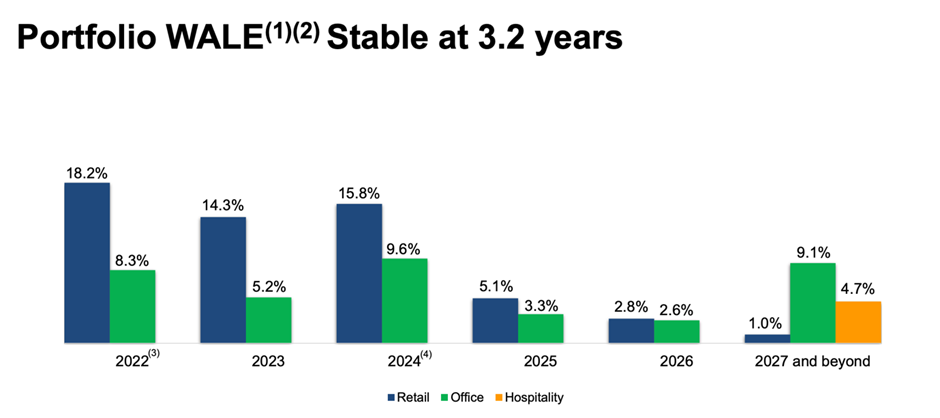
As stated above, Singapore’s properties usually have shorter WALEs than overseas properties. CICT REIT has an overall WALE of 3.2 years as of 31 December 2021. Hence, it scores 3 points here.
Metric #5: Gearing Ratio
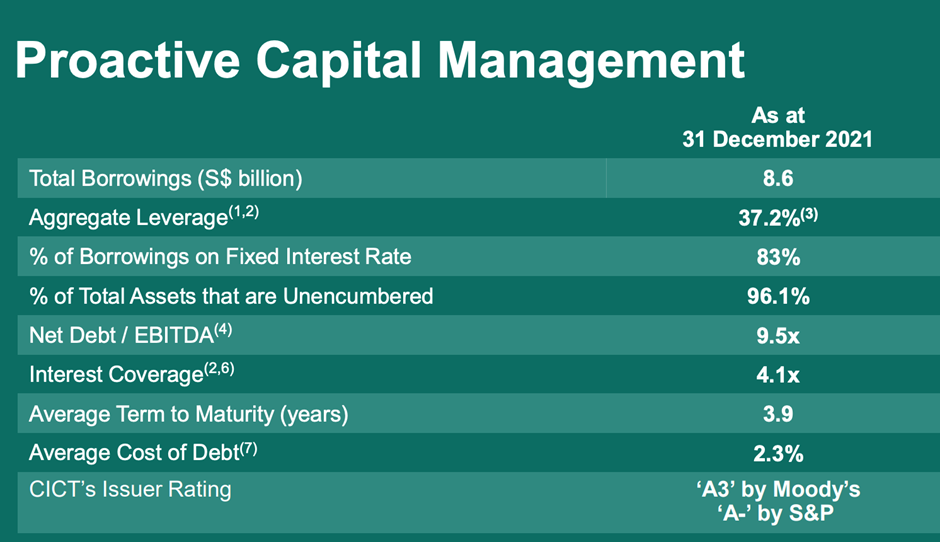
CICT REIT has a gearing ratio of 37.2%. It means the REIT is not taking on too much leverage. It scores 2 here.
Metric #6: Interest Coverage Ratio
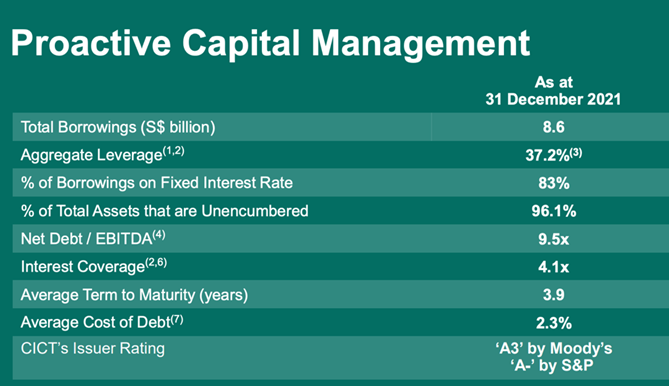
CICT REIT has an interest coverage ratio of 4.1x which is roughly the average. It means that Ascendas EBITDA can cover its interest charge by 4.1x. It is acceptable. Hence it gets 2 points.
Metric #7: Interest Cost

CICT has an average cost of debt of 2.3%. Fixed-rate debt consists of a significant portion (83%) of its total debt. This is above the industry average of 75.1%. This ensures that CICT would not be too badly affected by rising interest rates compared to its peers. Hence it gets 3 points here.
Metric #8: Average of Top Property and Top Tenant Contribution
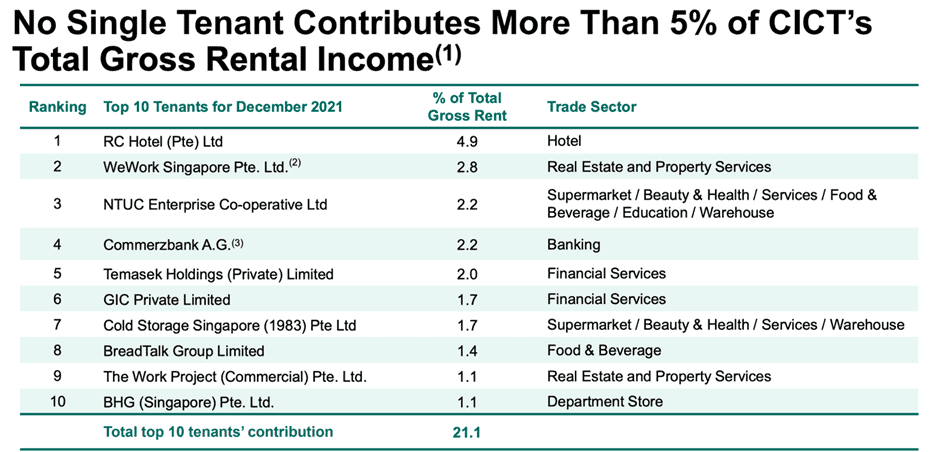
CICT is well-diversified with the highest contributor of income only at 4.9%. It scores a 5 here. This is important as CICT has some sturdy tenants such as NTUC Enterprise, Cold Storage, Breadtalk, and Temasek Holdings that would be fine paying higher rents during inflationary periods. The wide diversification of tenants also ensures stability as CICT is not dependent on one particular industry which might come under pressure during a recession.
Metric #9: Price / NAV
CICT has a NAV of 2.0642 as of 31 December 2021. It is currently trading at 2.15 at a price to nav of 1.042. It scores a 2 here. However, it is trading lower than the industry average of 1.057 which is strange considering the strength of the portfolio of properties the REIT owns.
Metric #10: Distribution Yield
CICT has a forward distribution yield of 4.84% based on its dividend for its latest full-year results. Given CICT’s long history of increasing its NPI and DPU (looking at CMT and CCT’s history), this distribution yield is likely to be sustainable going forward. It scores a 2 here.
Overall Score for CICT REIT based on a scoring system:
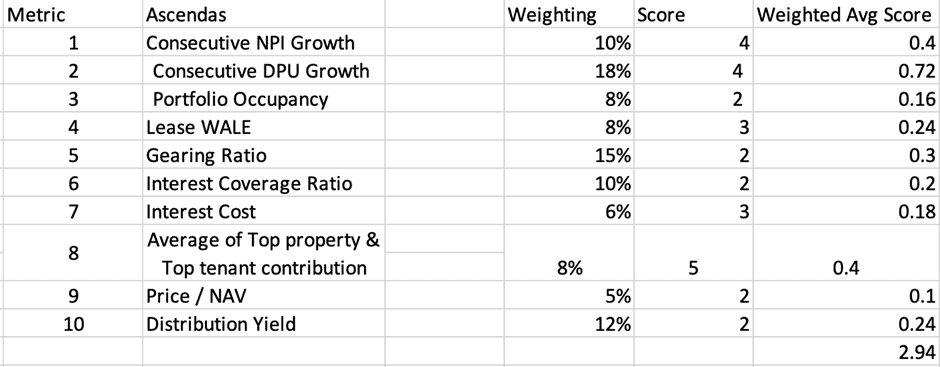
CICT’s total weighted average score of 2.94 is considerably lower than our consideration list of 3.50. As such, I would just hold if I already own units as I think this REIT would do very well when the economy does well and/or when Covid subsides due to its retail and office exposure.
However, for now, I would keep this REIT on my watchlist and would look to add units when it experiences a bigger selloff to more attractive levels.
Buying a basket of REITs through ETFs or Robo Advisors
For potential SG REIT investors who do not have the time to evaluate and select individual SG REIT stocks, one easy way to get exposure to the REIT sector is by purchasing a basket of REITs through an ETF such as the Lion-Phillip S-REIT ETF or a Robo Advisor such as Syfe’s 100% REIT portfolio
These are easy and convenient ways to get a broad-base exposure to a basket of REIT counters.
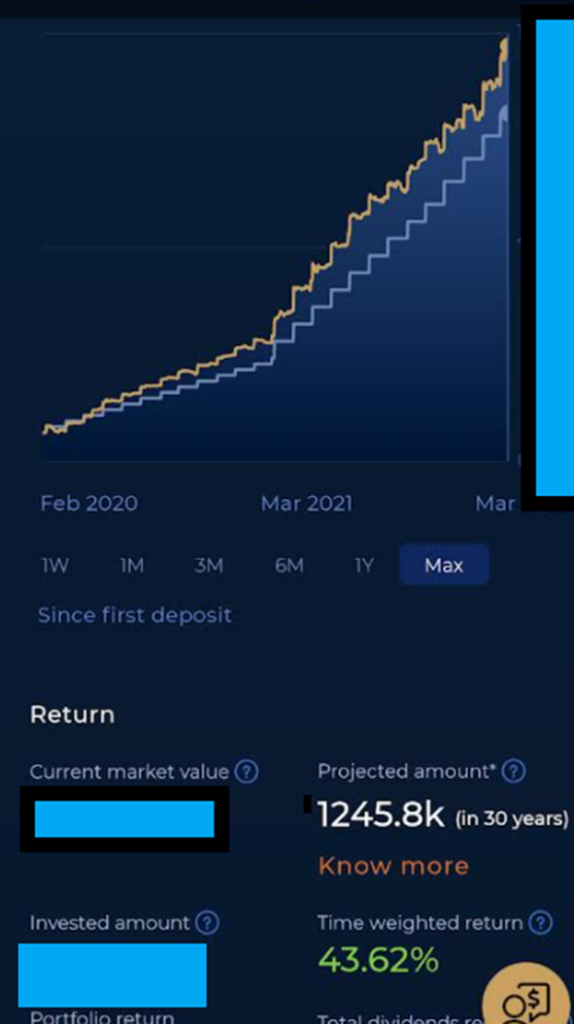
For myself, I am invested in Syfe’s 100% REIT portfolio through a dollar-cost-average approach or DCA for short, which allows me to accumulate quality SG Blue Chip REITs consistently and “on the cheap” when the sector was unloved back in 2020/21.
Despite an overall lackluster SG REIT sector performance in 2020/21/YTD22, through an automated DCA approach that removes the emotional and “attempt to time-the-market” aspects, my returns have been generally “decent” as seen from the portfolio snapshot below.
Conclusion:
In this article, I have revealed that real estate and REITs, in particular, can offer some protection against inflation. I have also shared my analysis on 2 popular blue-chip SG REITs. While I think Ascendas REIT is at an attractive level to start a position now, CICT has not quite reached an attractive level for me just yet.
It is important to pay attention to interest rate risks and recession risks as they might have a huge negative impact on REITs. Even though these 2 REITs would be in a better position than their peers to deal with the headwinds, they would still be dragged down nonetheless.
As always, these are my analysis of these 2 SG REITs. Please remember to do your due diligence before deciding to buy these REITs.
Do Like Me on Facebook if you enjoy reading the various investment and personal finance articles at New Academy of Finance. I do post interesting articles on FB from time to time that might not be covered here in this website.
Join our Instagram channel for more tidbits on all things finance!
Join our Youtube channel for short and sweet videos on all things finance!
SEE OUR OTHER WRITE-UPS
- DIVIDENDS ON STEROIDS: A LOW-RISK STRATEGY TO DOUBLE YOUR YIELD
- 10 GREAT REASONS FOR REITS INCLUSION IN YOUR PORTFOLIO AND 3 REASONS TO BE CAUTIOUS
- WHY I AM STILL BUYING REITS EVEN WHEN THEY LOOK EXPENSIVE
- 4 WAYS PARENTS CAN HELP THEIR CHILDREN (AND THEMSELVES) TO GRADUATE COLLEGE DEBT-FREE
- THE BEST PREDICTOR OF STOCK PRICE PERFORMANCE, ACCORDING TO MORGAN STANLEY
- PRE-PAYING YOUR HDB LOAN? THINK AGAIN
Disclosure: The accuracy of the material found in this article cannot be guaranteed. Past performance is not an assurance of future results. This article is not to be construed as a recommendation to Buy or Sell any shares or derivative products and is solely for reference only.


