

Dollar-cost vs. Lump-sum
Dollar-cost averaging is the strategy of breaking down a large sum of money and periodically deploying these smaller chunks of funds into investable assets such as stocks/bonds etc.
It forms the backbone of a regular savings plan, which is a consistent and disciplined way to invest. By automating a regular savings plan, for example, investing x dollars on a particular date of every month, it removes the emotional and psychological aspect of trying to time a market entry.
The Dollar Cost Averaging strategy is often compared to Lump Sum Investing. Which is better you might ask?
An evidence-based answer will point to the Lump Sum Investing strategy as the superior investing methodology.
In a scenario where one has a lump sum of $100,000 to invest, it will be better to choose the Lump Sum Investing method vs. spreading the $100,000 over X number of periods to be invested.
However, the sad reality is that not many of us have that amount of capital on hand. This is why I See Dollar Cost Averaging is a useful (but not the most ideal strategy to generate the highest return) strategy to get started on one’s investment journey.
Before I go into the gist of the article (hint: my solution is not simply just lump-sum investing), let me first demonstrate why if one already has a lump sum of capital on hand, it will make sense to invest this capital all at once vs. a dollar-cost averaging basis.
Let’s use historical data of the US market from 2000-2019.
We create two portfolios that have the same 100% exposure to the US stock market. However, one deploys a dollar-cost averaging approach, investing $10k each year from 2000 to 2019 for a total capital outlay of S$200k.
The second portfolio engages a lump sum investing strategy, deploying S$200k in 2000 and letting the market “work its magic” over the next two decades.
What is the conclusion?
The dollar-cost averaging approach generated a final balance of $735k vs. the lump sum approach of $678K.
Dollar-cost approach – Year 2000

Lump-Sum approach – Year 2000

Wait wait wait….. didn’t I just say that the lump sum strategy is supposedly superior vs. the dollar-cost averaging method? The “evidence” above doesn’t seem to justify that?
Before you start hurling quiet abuses at me, let me explain.
Using the Year 2000 as the starting year is just one reference point. It is the year where the US market, represented by the S&P500, witnessed a double-digit decline, the first since 1977. For the next 2 years, the S&P500 corrected by a further 13% in 2001 and 23% in 2002.
The total decline over the 3-year horizon from 2000-2002 was 46.6%.
A dollar-cost averaging approach will generally show superior results vs. a lump sum investing approach if the market correction occurs in the very early years.
In our illustration, that occurred right from the very first year of the downturn. Consequently, the dollar-cost average approach outperformed the lump-sum investing approach by $57k.
Let’s roll the period by 1 year and assume that both portfolios were started at the beginning of 2001 instead of 2000.
The dollar-cost approach method will still entail investing $10k each year for 19 periods while the lump sum approach will invest $190k right at the start.
Results? The $190k lump sum generated a final sum of $721k vs the dollar cost approach of only $678k. What a difference a year make and more extraordinary, the year 2001 and subsequently 2002 still saw cumulative market declines of c.26%.
In fact, the lump sum approach beat the dollar-cost averaging approach in 19 out of the 20 years horizon (based on the starting year of investing).
Yes, even during the GFC period, if we were to assume that the portfolios were created at the start of 2008 (peak of bear market), with $120k invested in the lump sum portfolio and $10k invested in the dollar cost average portfolio over the next 12 years, the lump sum approach will generate a final balance of $339k, edging out the dollar cost approach of $318k at the end of 2019.
Dollar-cost approach – Year 2008

Dollar-cost approach – Year 2008

Hence, the conclusion is that unless there is a prolonged downturn in the market (3 years and more consecutive market decline), investing through a lump sum approach is the superior methodology.
Despite the superior returns of lump-sum investing vs. dollar-cost averaging as illustrated by actual stock market performances, a key advantage of the dollar-cost averaging strategy touches the emotional component of investing, particularly when it comes to loss aversion.
Humans tend to prefer avoiding losses vs. acquiring equivalent gains which seems to partially explain why the dollar cost average approach is popular. Of course, we also highlight the simple fact that dollar-cost is so much easier for one to get started in his/her investment journey vs. a lump sum approach.
What if we can have the best of both worlds, meaning higher (than lump-sum investing) returns and lower risk (vs. dollar cost average) if we are facing a potential market downturn?
Our “Better alternative to Dollar Cost Averaging”
The key is portfolio allocation. Sure, by investing 100% into the equity market on a lump sum basis, this portfolio will generate the greatest return in a strong bull market (just like the one we had in the last decade) vs. a combination of other asset classes.
But in a prolonged market downturn just like the one which started in 2000 and which lasted for 3 years, the flaw of a 100% lump sum equity portfolio is evident. Not only will it generate inferior returns compared to a dollar-cost average approach, but the risk is also substantially elevated.
The Solution: Proper portfolio allocation by investing a lump sum into a combination of 40% equity, 40% long-term bonds, and 20% Gold.
How would such a portfolio (we term it the EBG portfolio) perform if vested from 2000-2019?
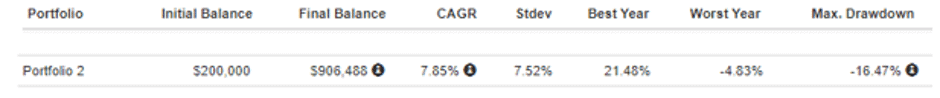
The EBG portfolio will generate $906k from 2000-2019 vs. $678k by investing a lump sum into the S&P500 and $735k by investing on a dollar cost average approach into the S&P500 (as we have previously alluded).
EBG approach – Year 2000
However, the EBG portfolio will not work if we engage a dollar-cost average approach where returns were only $636k from 2000-2019
Not only does the EBG portfolio (when using a lump sum approach) substantially outperform the market benchmark based on total returns, it did so with substantially lower risk. The standard deviation for the EBG portfolio is only 7.5% compared to 14.9% for the market portfolio.
When it comes to the maximum drawdown, the EBG has a maximum drawdown of 16.5% (from Mar 2008 to Oct 2008) while the market portfolio has a maximum drawdown of 50.89% (from Nov 2007 to Feb 2009).
While I understand the rationale for an investor choosing to dollar-cost average (I do it myself), a portfolio structure such as the EBG portfolio allows an investor to enjoy the full returns benefit of a lump sum investing approach and yet look to lower the overall portfolio volatility, similar to a dollar-cost averaging approach.
However, I do like to point out the fact that the EBG portfolio only outperforms the market portfolio (both using a Lump sum approach) if the construction year is 2000-2002 (the down markets). If the portfolios were constructed from 2003 onwards, the market portfolio will remain the superior one.
The question is whether one’s approach is to go for the largest potential total return or best risk-adjusted return.
If you ask me personally, considering that we are potentially in the last innings of this long bull market, I would go for the safer approach of vesting in the EBG portfolio on a lump sum basis vs. a 100% equity portfolio.
How about the NAOF portfolio?
Recall that the New Academy of Finance (NAOF) retirement portfolio structure consists of 20% equity, 20% bond, 40% REITs and 20% Gold.
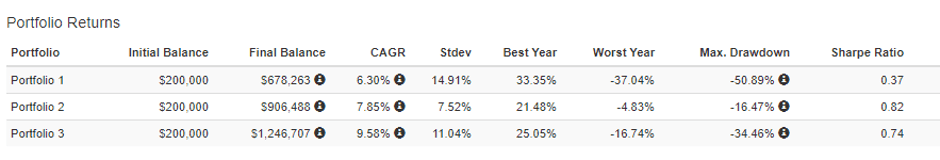
Such a portfolio structure, over the 2000-2019 horizon, when invested on a lump sum basis, will generate the highest total return of $1.25m, almost double that of the market portfolio!
This portfolio, however, has a higher standard deviation of 11% compared to the EBG portfolio of 7.5%. It has a max drawdown of 34.46% which is also substantially higher than the max drawdown of the EBG portfolio.
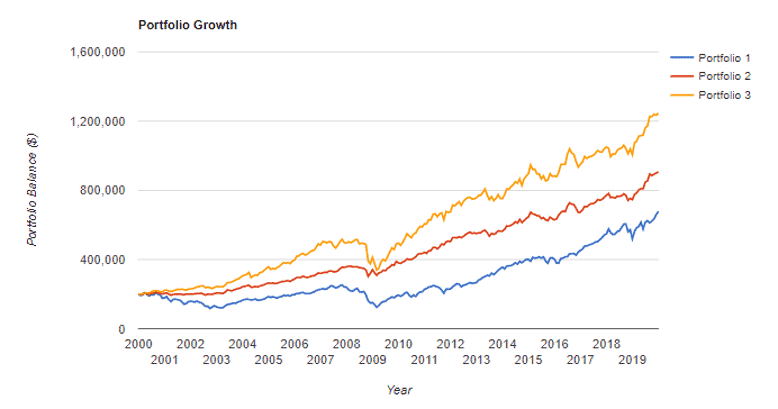
The diagrams below summarise the 3 portfolio returns based on a lump sum investing basis from 2000-2019:
Portfolio 1: Market portfolio
Portfolio 2: EBG portfolio
Portfolio 3: NAOF portfolio

Conclusion
Investing on a Lump Sum basis has proven to be the superior method compared to dollar-cost averaging.
However, dollar-cost averaging remains a very popular investment method, primarily because it addresses the issue of 1) capital shortage and 2) regret-averse about potential losses. An investor who fits either these two profiles can still consider dollar-cost averaging as a regret minimization technique.
Personally, I am open to investing based on a lump sum approach by structuring the NAOF portfolio which I personally believe has excellent risk-adjusted returns and has demonstrated to be able to withstand significant market downturns.
An alternative solution
Alternatively, I may use an “adjusted dollar-cost averaging strategy”, with a disciplined approach of investing a fixed X dollar each month into a 100% equity market while increasing that dollar amount after a bear market year. Such a strategy will still underperform a lump sum approach on an upmarket but in a severe bear market, I now do have the ammunition to structure a “partial lump-sum” investment, depending on the severity of the market.
For example, instead of investing a fixed $10k every year on a dollar-cost averaging basis, I will increase the investment amount to $25k when the market declines by single-digit and $50k when the market declines by double-digit in the prior year and then reverting back to $10k thereafter, until my capital is fully deployed.
Recall that I mentioned earlier that the lump-sum strategy was superior in 19 out of the 20 years (in which the portfolio was started) vs. the dollar-cost approach. By avoiding the Year 2000, the lump-sum approach would have come up tops in all the other years.
By using this “adjusted dollar-cost averaging strategy”, our data shows that this strategy is superior to the lump sum one if both portfolios were started in 2000-2003 (during the bear markets) in terms of returns but still trails the lump-sum portfolio if the portfolios were constructed from 2004 onwards.
This adjusted dollar-cost averaging strategy looks to address the risk of investing fully at the peak of the market. We partially mitigate volatility risk by not being “fully-vested” right from the start and can afford to increase our dollar amount vested substantially after a down-market.
Do Like Me on Facebook if you enjoy reading the various investment and personal finance articles at New Academy of Finance. I do post interesting articles on FB from time to time which might not be covered here in this website.
Join our Telegram broadcast: https://t.me/gemcomm
SEE OUR OTHER WRITE-UPS
- DIVIDEND YIELD THEORY – THE UNDERAPPRECIATED VALUATION TOOL
- TOP 5 ANALYSTS OF THE DECADE AND THEIR CURRENT FAVORITE STOCKS
- IS DRINKING LATTE REALLY COSTING YOU $1 MILLION AND THE CHANCE TO RETIRE WELL?
- DIMENSIONAL FUNDS: ARE THEY WORTH THEIR WEIGHT IN GOLD?
- THE CONFUSING MATH BEHIND RETIREMENT SUM SCHEME AKA CPF LIFE PREDECESSOR
- DIVIDENDS ON STEROIDS: A LOW-RISK STRATEGY TO DOUBLE YOUR YIELD
Disclosure: The accuracy of the material found in this article cannot be guaranteed. Past performance is not an assurance of future results. This article is not to be construed as a recommendation to Buy or Sell any shares or derivative products and is solely for reference only.


