
Table of Contents
Best Value Factors
Value investors tend to use a mixture of “value”-based financial metrics in a bid to uncover “cheap” stocks, or more appropriately termed “undervalued” stocks where one can purchase at a discount to their fair value.
There are many value-related financial metrics that a value investor can engage to screen for cheap stocks, 41 value factors to be exact.
According to a recent deep-dive report by Jefferies, they have uncovered that the best value factor to look at among all 41 value factors across 12 categories is those cash flow-related ones.
Across the US, cash flow-related value factors have been the best over the past 25 years to source for undervalued stocks while more popular financial metrics such as Price to Earnings (PE) and Price to Book (PB) ratios have low consistency.
I have previously written in an article: The Best Predictor of Stock Price Performance where I highlighted that the best stock price predictor is also a cash flow-based metric, one which has beaten the market by 8.3ppt over the past 22 years.
Best Value Factors across industries
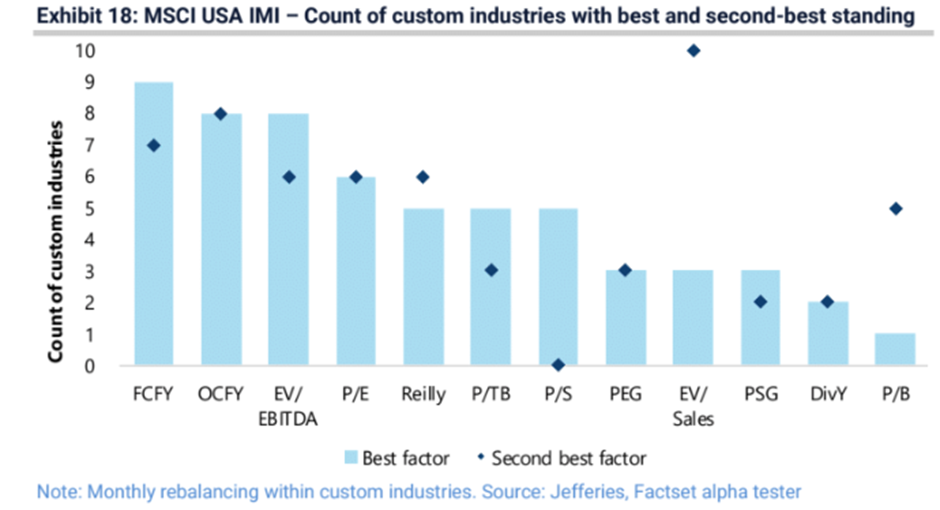
The two best value factors for each custom industry were Free Cash Flow Yield (FCFY) and Operating Cash Flow Yield (OCFY), while PB and Dividend Yield lagged. According to Jefferies, the best value strategy has delivered a cumulative long-short excess return of 9.5% since 1998, vs. only 2.9 %/annum using only PE & PB factors.
To enhance the returns and avoid falling into the so-called “Value Traps” aka cheap stocks that remain cheap for a prolonged period, one can overlay these value factors with 3 key fundamental factors – 1) Quality, 2) Revision, and 3) Momentum to get the best results.
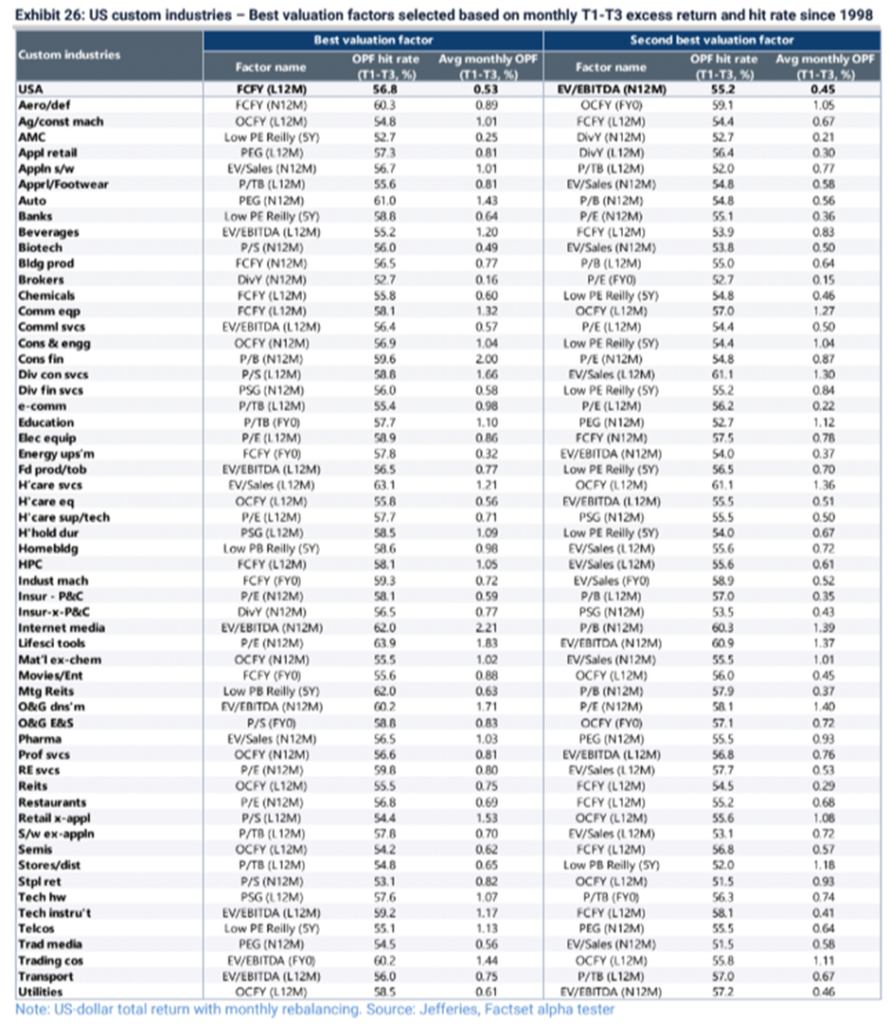
Free Cash Flow Yield was identified to be the best value factor for 9 custom industries followed by Operating Cash Flow Yield and EV/EBITDA.
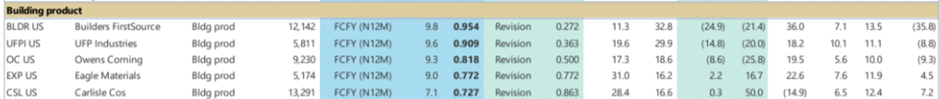
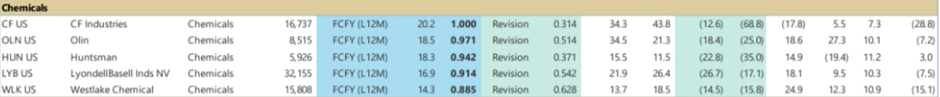
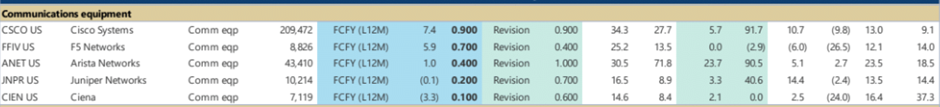
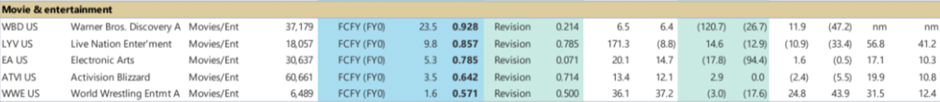
The table below shows the best and second-best valuation factors for each custom industry in the US.
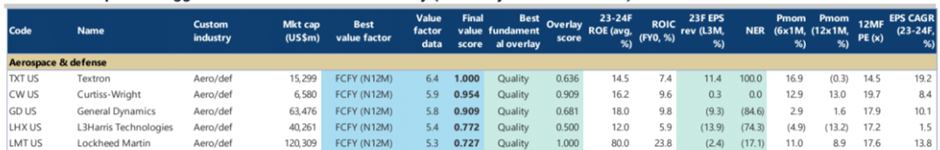
Some of the cheap stocks that can be found in these industries where using the Free Cash Flow Yield metric is the best value factor are also shown below:
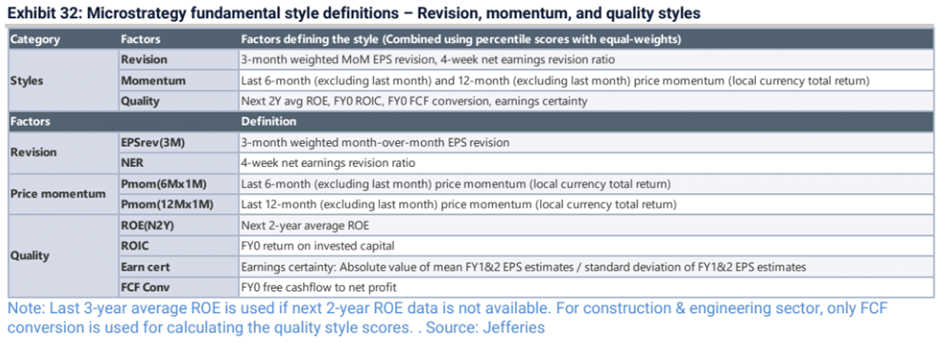
As earlier mentioned, to enhance the effectiveness of the free cash flow yield screening metric, it will be ideal to have a fundamental overlay based on the 3 fundamental factors: 1) Quality, 2) Revision, and 3) Momentum.
The details of the factors and the relevant metrics to be used can be found in the table below.
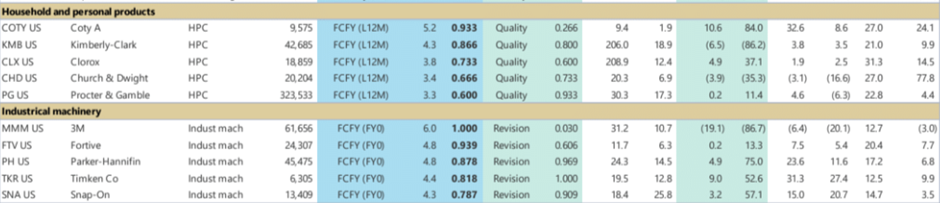
Example: Household and Personal Products
Using the Stock Rover screening platform, I screened the household and personal products industry for stocks that exhibit free cash flow yield >= 3%. I also combined it with a high ROIC percentage (a measure of quality) of > 15% as the overlaying factor.
The table below illustrates the stocks in this category that ranks very well based on the above 2 financial criteria:
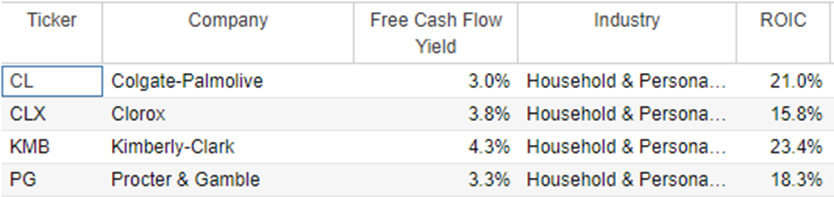
Only 4 stocks in this industry meet the above criteria, with Kimberly Clark likely the standout candidate with the highest free cash flow yield ratio of 4.3% as well as the highest ROIC ratio of 23.4%.
Example: Energy Upstream
Another industry in which Jefferies did not highlight the cheapest stocks based on the Free Cash Flow Yield metric that ranks as the best value factor is the Energy upstream industry.
Again, I screened for stocks in this industry that fulfill a combination of both a high free cash flow yield (> 10%) and a High ROIC (> 15%). The result is shown in the table below:
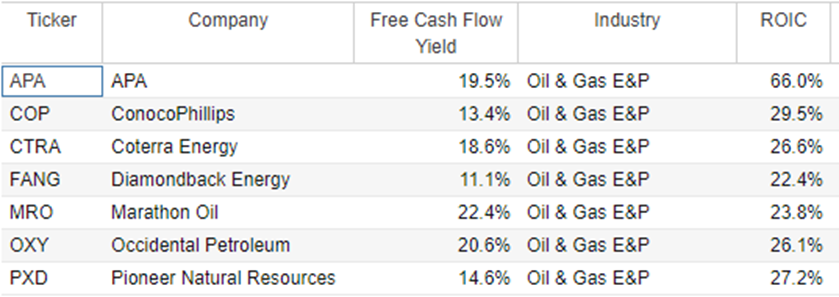
Quite a handful of the stocks in this industry score very well based on the free cash flow yield and ROIC metrics.
One area to note for stocks in the energy upstream industry is the cyclical nature and high dependency on oil prices, the latter being rather volatile of late.
During good/supernormal times when oil prices are high, both profitability and free cash flow generation are strong. This will positively impact both its FCF yield and ROIC.
However, the bigger question pertains to the sustainability of such profit and cash generation of these companies in a normalized environment.
Not a metric that can be broadly applied to all stocks
While historical data has shown that the Free Cash Flow Yield metric is one of the best value factors to identify cheap stocks that can exhibit strong price performance in the foreseeable future, it is likely not a metric that can be broadly applied to all stocks.
As shown by the in-depth research done by Jefferies, this metric works well in identifying “cheap” stocks only in certain industries. Using this metric across a sector such as financial services will result in a rather erroneous conclusion.
A Simpler Solution to Screen for High-Quality Stocks
I am a fan of cash flow-related factors as well. At the end of the day, some would say cash is king. A business that demonstrates high profits all the time but is constantly burning cash, is highly questionable.
On the other hand, highly cash-generative companies which are loss-making due to non-cash-related expenses, might not be fully appreciated by the market.
Ideally, I would like a stock that exhibits both growing profits and cash flow that is also expanding alongside its bottom line.
This is one of the key metrics that I used to screen for high-quality companies in the Alpha Blueprint Portfolio.
While I do not use a “hard number” to dictate what a good free cash flow yield figure might be, as different industries might see huge variation (the best household product stocks only have a free cash flow yield of 4+% while that of the best energy upstream counters have free cash flow yield close to 20%), free cash flow must be growing in tandem with the company’s profits.
In addition to the all-important free cash flow value factor, I combine it with 4 other growth/value factors to derive what I termed as my Power of 5 financial factors to find the best of the best blue-chip stocks, companies which are often the market leaders in their respective industries.
In addition to that, I combine it with a timing factor which I termed as my Smart Impulse factor to buy these high-quality (RIGHT) companies at the best (RIGHT) time.
For my readers who are interested to learn more about this stock selection approach, do click on the button below to get more details.


