
Investor Education Series: Portfolio Allocation Structure
A proper portfolio structure is akin to the foundations of a house. It needs to be set right so that what goes on top of it is on a firm footing.
While a young investor with plenty of time on his/her side might be better off fully invested in the equity market to let the power of compounding work its magic, a soon-to-be-retiree will need to be more conscientious in structuring a proper portfolio allocation if he/she wishes to have a worry-free retirement.
I have previously talked about the 4% withdrawal rule that all retirees should be aware of. In that article, I first introduced to my readers the “Ideal” portfolio allocation structure, one I termed as my NAOF Portfolio and I reasoned why this portfolio structure is superior to that of the 60:40 equity to bond portfolio structure which is more commonly known.
In this article, I go one step further and benchmark this portfolio against other well-known portfolio allocation structures such as the All-Weather Portfolio, Golden Butterfly Portfolio, Three-Fund Portfolio, etc.
The NAOF Portfolio will be benchmarked against 9 other portfolio allocation structures. Which will come out tops and is that the best portfolio allocation structure for you?
Before that, let me just briefly highlight the 4% withdrawal rule for the benefit of readers who are not familiar with this retirement withdrawal structure.
The 4% safe withdrawal rule
In a simple nutshell, this is the amount of money you might withdraw each year from the starting value of your portfolio of stock and bonds in retirement and not risk running out of money over a 30 years horizon.
For example, if you have $1,000,000 when you retire, the 4% rule would say that you could withdraw 4% of that amount each year, which is $40,000 for the first year.
In the second year, after adjusting for 3% inflation, we can withdraw $41,200. This can continue for 30 years, adjusting for a 3% increment each year, and ultimately the portfolio will not run dry for 30 years.
Let’s do some “simple” maths. Assuming a 3% inflation rate, what is the total amount of withdrawal for the full 30 years, ie Year 1 withdrawal = $40,000, Year 2 Withdrawal = $41,200…… Year 30 withdrawal = $94,262
Over 30 years, one will withdraw approx. $1.9m. That is a huge sum of money, one that might concern a soon-to-be retiree.
The key point to note, however, is that the “new” retiree need not have $1.9m in his/her retirement account on retirement age (for example Age 65). He/she only requires a much smaller amount, by my calculation, approx. only $330k (excluding pension) at Age 65 to “finance” this $1.9m in total liabilities over the next 30 years.
Of course, there are various assumptions made in this projection, with the key one being that the average market return over the next 30 years is approx. 7%. I will talk more about this projection in a separate article.
Note that to achieve an average 7% return is however quite a herculean task for a portfolio structure that is not 100% equity.
A 100% portfolio equity structure will likely give the greatest average return. Based on data from portfoliocharts.com, a 100% stock market portfolio would have generated an average market return of 8% since the 1970s.
However, such a portfolio will also have the largest variability as represented by the standard deviation metric at 17% and quite surprisingly, the safe withdrawal rate is only at 4.3%, one of the lowest when compared against all the other popular portfolio structures.
So, yes, a 100% equity portfolio might have the greatest average return over a long horizon but it is not likely something that a soon-to-be-retiree should be structuring. That likely is a recipe for disaster especially if combined with sequence of returns risk. What exactly is sequence of returns risk? Click on the link to find out more.
I have provided a brief introduction to the 4% withdrawal rule. Let us now unveil the best portfolio allocation structures in terms of both long-term returns track-record and more importantly, the ability to withstand any economic/stock market condition and not run out of capital.
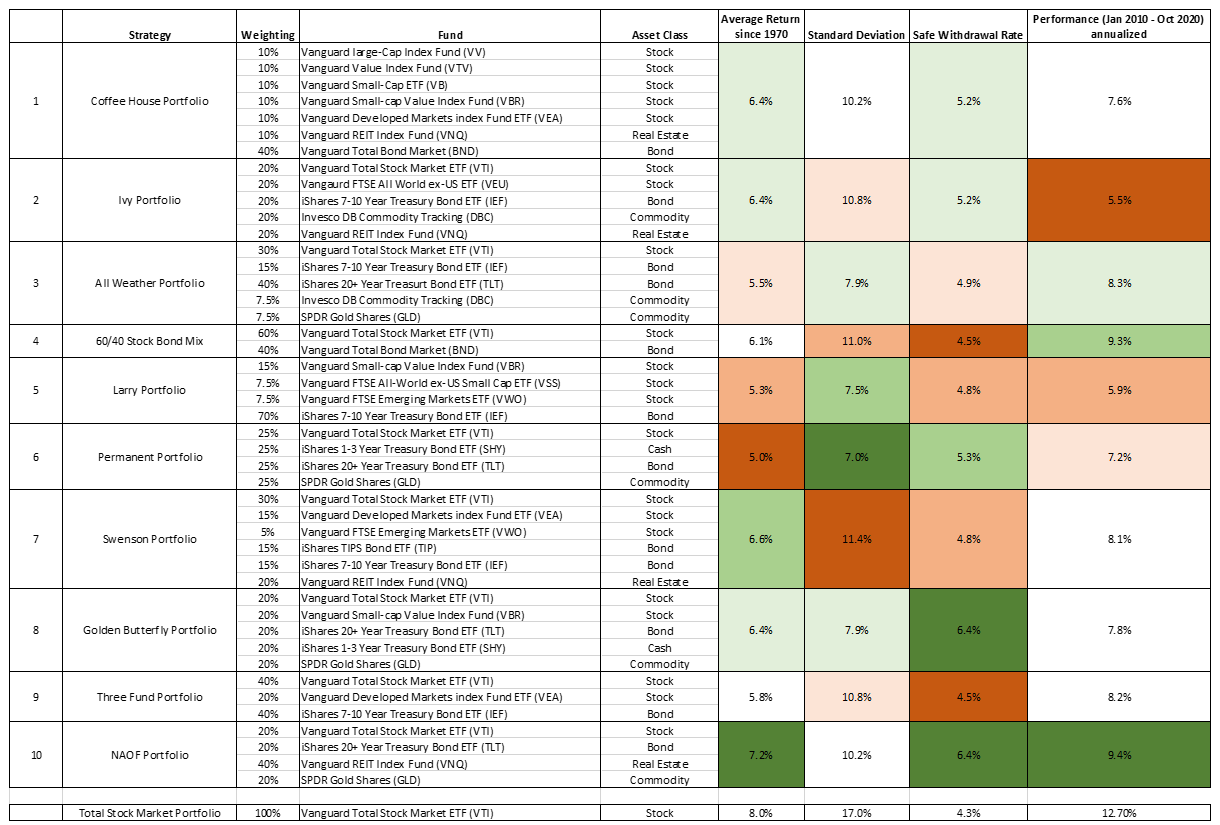
I will be going through the 10 Portfolio structures in brief and end off with a table that summarizes the performance of the various portfolios, using data from portfoliocharts and portfoliovisualizer. This is done by selecting certain ETFs that fit the profile of the portfolio allocation structure of the portfolio.
For example, if the portfolio allocation calls for an asset that requires total stock market composition, I would select the VTI ETF or Vanguard Total Stock Market ETF to represent that particular composition and so on and so forth.
Best portfolio allocation structure
Coffeehouse Portfolio
The Coffeehouse Portfolio was designed by Bill Schultheis, a financial adviser and co-founder of Soundmark Wealth Management. You can read more about it at his website The Coffeehouse Investor, and in his book by the same name.
The Coffeehouse Portfolio is hands-off investing; you make no changes to it apart from rebalancing once a year so the original portfolio allocation remains intact.
According to Bill Schultheis, there are three fundamental principles to successful investing:
- Portfolio allocation: Having the right mix of securities in your portfolio.
- Approximating the Stock Market Average: Not attempting to beat the market.
- Saving: Choosing and maintaining a savings rate that matches your financial goals.
Portfolio allocation
- 10% Large Cap Blend
- 10% Large Cap Value
- 10% Small Cap Blend
- 10% Small Cap Value
- 10% International Stocks
- 40% Intermediate Bonds
- 10% REITs
Ivy Portfolio
The Ivy Portfolio attempts to diversify your money by dividing it into stocks, bonds, commodities, and real estate in a way that mirrors the Ivy League endowment funds.
It’s a way for individual investors to emulate the portfolio allocation strategies used by Ivy League Universities. The Ivy Portfolio doesn’t attempt to mirror every move the endowment fund makes.
That’s impossible. What is possible is to copy their portfolio allocation strategies.
Mebane T. Faber and Eric W. Richardson created the portfolio in the book, The Ivy Portfolio: How to Invest Like the Top Endowments and Avoid Bear Markets.
Meb Faber is the driving force behind this strategy.
Portfolio allocation
- 20% Total Stock Market
- 20% International Stocks
- 20% Intermediate Bonds
- 20% Commodities
- 20% REITs
All-Weather Portfolio
This portfolio is created by Ray Dalio, one of the most successful fund managers today. With such a catchy name, it is no wonder that the All-Weather Portfolio is one of the most popular portfolio structure today, with millions looking to structure this portfolio as a passive form of investing.
This portfolio’s single goal is to make money in all market conditions regardless of interest rates, deflation, what new pandemic is threatening our shores, or who the POTUS is. It does this by focusing on growth and inflation cycles.
According to Dalio, growth and inflation are all that matters. They are either up or down, and there are various combinations.
Growth is up; inflation is down. Growth is down, inflation is up, etc.
Portfolio allocation
- 30% Total Stock Market
- 40% Long Term Bonds
- 15% Intermediate Bonds
- 7.5% Commodities
- 7.5% Gold
Tony Robbins is a huge advocator of the All-Weather portfolio, highlighting this concept in his book: Money Master the game: 7 simple steps to financial freedom.
60:40 Stock Bond mix Portfolio
The Classic 60-40 portfolio is the ubiquitous portfolio allocation that serves as the benchmark in most portfolio discussions. Popularized by Jack Bogle — the founder of Vanguard who pioneered index investing — the Classic 60-40 portfolio has long been a staple of passive investors.
Other versions include varying the percentage by age, starting from 100. So if you are Age 20 today, your allocation to stocks should be 100-20 = 80%
Likewise, if you are 50 today, then you should have a portfolio structure that is 50% stock and 50% bonds.
A very popular strategy and understandably so, given its simplicity. However, in today’s low-interest-rate environment, there are concerns that the 40% bond composition will no longer be able to protect an investor from downside risks associated with a bearish market where the scope to further reduce interest rates to “stimulate the economy” is now greatly curtailed.
Portfolio allocation
- 60% Total Stock Market
- 40% Intermediate Bonds
Larry Portfolio
The Larry Portfolio is the name for a class of portfolios promoted by Larry Swedroe and Kevin Grogan in the book Reducing The Risk of Black Swans.
Mr. Swedroe suggests by tilting your portfolio to higher-risk asset classes that generate superior returns, you could hold less in stocks and more in safer investments (e.g., bonds).
Larry refers to it as a low-beta/high tilt portfolio.
Buy riskier stock funds, reduce your equity exposure, and decrease portfolio volatility. How?
Portfolio allocation
- 15% Small Cap Value
- 7.5% Int’l Small Cap Value
- 7.5% Emerging Markets¹
- 70% Intermediate Bonds
Take a look at the core components of the Larry Portfolio. How does a portfolio holding 70% bonds sound to you?
For some investors, 70% is the perfect mix, while others feel it’s too conservative.
This portfolio’s goal is to be both high performance and low volatility. It achieves its performance by tilting your portfolio to higher-risk stocks that are underpriced. Its low volatility is due to only holding 30% in stocks while 70% goes to bonds.
It’s a bit like a barbell strategy where you invest in two market extremes, both high and low-risk while avoiding the middle.
So how did such a portfolio perform? I will talk more about that later.
Permanent Portfolio
The Permanent Portfolio (PP) is a portfolio evenly split between stocks, bonds, gold, and cash. Harry Browne introduced the concept in his book, Inflation-Proofing Your Investments, in 1981.
Mr. Browne designed the portfolio to weather all economic conditions something like the All-Weather Portfolio.
So which is better? The Permanent Portfolio or the All-Weather Portfolio?
Just to give you guys a quick preview, the All-Weather Portfolio edges out the Permanent Portfolio based on average return since 1970 but the Permanent Portfolio has a lower standard deviation, ie less variability compared to the All-Weather
Portfolio allocation
- 25% Total Stock Market
- 25% Long Term Bonds
- 25% Cash
- 25% Gold
The even split between the above four categories makes it easy to model.
Gold, stocks, and bonds are volatile assets but can move independently of one another. The economic conditions will dictate their movements.
Browne suggests rebalancing annually to ensure your portfolio allocation doesn’t drift and maintains its efficiency.
Another quick preview: with 25% in cash, it is likely that this portfolio allocation structure underperforms the rest in the bull market of the last 10-years. We will find out more later.
Swenson Portfolio
David Swensen is the President and Chief Investment Officer of Yale’s endowment. Swensen, along with Dean Takahashi, invented The Yale Model.
He then wrote a book called Unconventional Success detailing how individual investors can mirror The Yale Model in their portfolios.
The final product is what’s known as the Swensen Portfolio.
He attempts to diversify it with a portfolio allocation combining the total stock market, international stocks, emerging markets, intermediate bonds, and real estate in the form of REITs.
Portfolio allocation
- 30% Total Stock Market
- 15% International Stocks
- 5% Emerging Markets
- 30% Intermediate Bonds¹
- 20% REITs
The Swensen Portfolio divides the bulk of its portfolio allocation between US stocks and Intermediate bonds.
Instead of investing directly in brick and mortar real estate, the Swensen Portfolio advises 20% to be put into REITs (Real Estate Investment Trusts).
International stocks make up a slightly smaller portfolio allocation at 15% of the total fund with emerging markets having a smaller slice at 5%.
While the long term returns of the Swensen portfolio has been decent, it has the highest standard deviation across all the portfolios (except for the total market portfolio) and also one of the lowest safe withdrawal rates. More on that later.
Golden Butterfly Portfolio
Matching the high return of the Total Stock Market with the low volatility of the Permanent Portfolio, the Golden Butterfly is a home-grown Portfolio Charts sample portfolio that combines some of the best features of other portfolio allocations into a stable and efficient investment strategy for accumulation and retirement alike.
The Golden Butterfly is a small change to the All-Weather Portfolio. While Dalio is agnostic about the stock market, the Golden Butterfly skews toward prosperity. And for a good reason. Over time, there have been more times of economic growth than times of decline and recession.
Portfolio allocation
- 20% Total Stock Market
- 20% Small Cap Value
- 20% Long Term Bonds
- 20% Short Term Bonds
- 20% Gold
The portfolio allocation of the Golden Butterfly is not a popular one. Most of those in the world of personal finance don’t recommend gold as an investment although that investment thesis has now become more mainstream with the money printing press going out of control.
I have written about investing in gold as an inflation hedge.
Long term treasuries are volatile for bonds and are at risk of losing significant value in the future. Small-cap value is controversial and value as a whole has been a big underperformer over the past decade.
So quite a number of unpopular assets comprising the Golden Butterfly Portfolio. Can its performance live up to its beautiful name? We shall find out later.
Three Fund Portfolio
The Three-Fund Portfolio by Taylor Larimore is an investing staple on the fantastic forums at Bogleheads.org. While the specific allocation percentages may vary by an individual investor, the one represented here is a good starting point.
Portfolio allocation
- 40% Total Stock Market
- 20% International Stocks
- 40% Intermediate Bonds
It’s a simple portfolio structure, something similar to that of the 60:40 equity to bond structure, with the key difference being that 20% has been allocated to international stocks. This provides a more diversified exposure.
One should however expect such a structure to generate pretty much similar returns to the 60:40 portfolio structure.
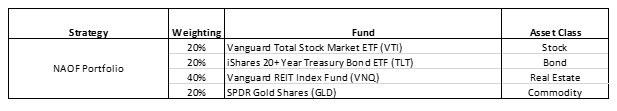
NAOF Portfolio
Last but not least, we have the NAOF structure which is introduced by me when I first wrote about it in this article.
The portfolio was created with retirement planning in mind and wasn’t meant to “outperform” the market.
It will however be ideal to have a portfolio structure that demonstrated the ability to consistently outperform the market in all market conditions while yet at the same time, “stable” enough to ensure that withdrawing x% each year to fund one’s retirement expenses will not disadvantage the retiree in terms of “selling at the low”.
The NAOF portfolio seems to fit that structure based on the conclusion then. It has a high safe withdrawal rate of 6.4% versus the 4% benchmark. Meaning that if you have got a $1m retirement portfolio at the start of your retirement journey, you can afford to withdraw out $64,000 per annum in your first year, and thereafter the annual withdrawal amount adjusted for inflation over a 30 years horizon and not risk running out of money.
$64k vs $40k. No brainer?
Portfolio allocation
- 20% Total Stock Market
- 20% Long Term Bonds
- 40% REITs
- 20% Gold
Not only did the NAOF portfolio provides the portfolio stability that is so critical for a retiree, but it also outperforms the market generally over a long horizon. Let’s take a look as we unveil the best portfolio allocation structure next.
Best portfolio allocation structure for a retiree

What I have done is that for each portfolio, I associate each asset type with the most relevant ETF with a sufficient historical track record.
So, for example, the Permanent Portfolio is structured with the following ETFs:
Stock: Vanguard Total Stock Market ETF (VTI)
Cash: iShares 1-3 years treasury bond ETF (SHY)
Bond: iShares 20+ years treasury bond ETF (TLT)
Gold: SPDR Gold Shares (GLD)
I have color-coded the results, with the best-performing ones in the darkest shade of green and the worst-performing one in the darkest shade of orange.
Lo and behold, the winner of the best portfolio allocation structure is none other than my NAOF portfolio structure.
I expected the NAOF portfolio to beat the 60:40 stock to bond mix portfolio, based on my previous research. The 60:40 structure fared “average” in terms of long term returns and quite poorly based on a safe withdrawal rate criterion.
What I did not expect was that not only does this portfolio structure has the highest safe withdrawal rate at 6.4% (on-par with Golden Butterfly), it has also generated the highest long-term average return of 7.2%, based on data from portfoliocharts. In terms of volatility, it is “neutral” with higher volatility compared to its closest competitor, the Golden Butterfly Portfolio.
So, you have the best of both worlds, one where you have a high safe withdrawal rate and yet at the same time, generating the highest average return since 1970. While this portfolio was structured with the retiree in mind, a younger investor can also choose to structure such a portfolio to generate “steady and superior” returns till his retirement date.
A 100% equity portfolio structure will of course give the highest returns but that also means taking on greater risks in terms of the portfolio’s standard deviation.
Conclusion
The “evidence” seems to point to the fact that the NAOF portfolio is the best portfolio allocation that allows a retiree to sleep well at night.
I did not cherry-pick the various portfolio allocation structure to compare against NAOF portfolio. Those portfolio structures are pretty well-known and have been written on numerous occasions by financial bloggers.
The data have been pulled from portfoliocharts.com as well as portfoliovisualizer.com, both very useful websites to structure your portfolio allocation based on different asset classes and back-test those results.
For US investors you can automate it with a Robo advisors such as M1 Finance. Enter your email and create a password. M1 Finance doesn’t charge for portfolio management, placing trades, or for deposits and withdrawals connected to your bank account.

M1 Finance
They’re perfect for DIY investors who prefer a hands-off approach but can still pick individual stocks and funds. You can use M1 Finance to structure a retirement portfolio such as the NAOF Portfolio.
If you’re building a portfolio from ETFs, you can incur management fees from the underlying funds, but the fees are low, ranging from 0.06% to 0.20%.
Once you’ve created your account, you’ll be taken to the “pie-building” page, where you can create your portfolio using ETFs, index funds, or individual stocks.
For those looking to implement the NAOF structure, you can structure it by purchasing the following ETFs:
Join our Telegram broadcast: https://t.me/gemcomm
SEE OUR OTHER WRITE-UPS
- How to outperform the market by 100+%
- How to prepare for a bear market. A simple 3-steps process
- Growth Investing: How to find growth stocks to invest in
- What exactly is a Poor Man’s Covered Call?
- Finding great companies with network effect
- Let the Power of Compound Interest help you reach millionaire status
Disclosure: The accuracy of the material found in this article cannot be guaranteed. Past performance is not an assurance of future results. This article is not to be construed as a recommendation to Buy or Sell any shares or derivative products and is solely for reference only.


