

In this article, I seek to identify some of the best dividend growth stocks and I will look to use empirical numbers to show how a consistent dollar-cost averaging strategy (based on an annual investment outlay of $10k) can help you to achieve millionaire status over 20 years.
Disclaimer: I have got no magical crystal ball in front of me and while I use historical data as my assumption basis, there is no guarantee that future performances will be a replication of historical returns.
I have previously written about the Dividend Yield Theory method to derive a fair value for dividend-paying stocks. The analysis done in this article will aim to derive the stock’s fair value based on this methodology, albeit with a twist.
I will show you how a $10k annual investment (for 20 years) into these 6 dividend growth stocks can help you to achieve millionaire status after 20 years.
Best Dividend Growth Stocks
Dividend Investing is a popular investing strategy that has been deployed by investors all over the world. It is particularly popular among those who wish to derive a passive stream of income, intending to generate sufficient passive income to support an early retirement.
I have written a very detailed article on dividend investing which I believe is very helpful in gaining a better understanding of the different dividend investing methodologies.
The best dividend investing strategy, based on historical data, is to invest in strong dividend growers. These are companies that have a good track record of increasing their dividend payments year after year.
Strong dividend growers need not be high dividend-yielding companies. There is a huge difference in that, the former illustrating strong dividend per share or DPS growth whereas the latter is one where you receive a high dividend payment based on each dollar of capital you invest in.
High dividend yield vs. High dividend growth
For example, company ABC pays a DPS of $1/share. With its price at $100, the company’s dividend yield is 1%, calculated as $1/$100=1%. While its yield is low, ABC is expected to grow its DPS payment to $1.20 next year or a 20% YoY growth. ABC is a strong dividend grower.
On the other hand, company XYZ pays a DPS of $10/share. With the same share price of $100, the company’s dividend yield is 10%. Calculated as $10/$100=10%. While its yield is high, XYZ is expected to grow its DPS payment to $10.10 next year or a YoY growth of just 1%. XYZ is a higher dividend-yielding stock by a weak dividend grower.
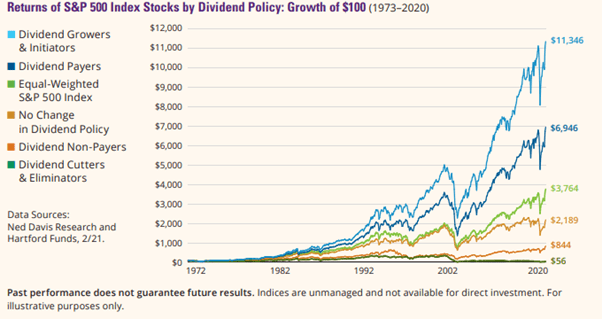
Based on historical empirical data, it is shown that strong dividend growers generate the best TOTAL returns (dividend + capital appreciation) for investors.
In this article, we will be focused on finding some of the best dividend growth stocks that can turn your $10k annual investment into a $1m portfolio over 20 years.
A step-by-step methodology to find the best dividend growth stocks
Step 1: Screen for stocks that have at least 10 years of consecutive DPS growth
To find those dividend growth stocks that can turn an annual investment of $10k into a million-dollar portfolio over 20 years, I first seek to screen for blue-chip stocks (in the S&P 500) that have at least 10 years of consecutive growth in dividend payments.
The table below presents the stocks with more than 10 years of dividend growth history.
| Ticker | Company | Price | Market Cap ($M) | Dividend Per Share | Dividend Yield | Payout Ratio | Dividend 1-Year Chg (%) | Dividend 3-Year Avg (%) | Dividend 5-Year Avg (%) | Div. 10Y Avg (%) | Lowest Growth Rate (%) |
| ABC | AmerisourceBergen | $116.44 | $24,140 | $1.76 | 1.50% | – | 4.80% | 5.00% | 5.30% | 14.40% | 4.8% |
| ADI | Analog Devices | $169.17 | $62,118 | $2.76 | 1.60% | 60.30% | 11.30% | 12.90% | 10.40% | 10.70% | 10.4% |
| ADM | Archer-Daniels Midland | $60.71 | $33,918 | $1.48 | 2.40% | 39.30% | 2.80% | 3.40% | 4.30% | 8.70% | 2.8% |
| ADP | Automatic Data Processing | $199.81 | $84,593 | $3.72 | 1.90% | 63.60% | 2.20% | 10.50% | 11.90% | 10.00% | 2.2% |
| AEP | American Electric Power | $85.26 | $42,276 | $2.96 | 3.50% | 62.60% | 5.70% | 6.10% | 5.70% | 4.90% | 4.9% |
| AFL | Aflac | $54.00 | $36,626 | $1.32 | 2.40% | 15.00% | 17.90% | 8.30% | 10.00% | 8.20% | 8.2% |
| AIZ | Assurant | $156.85 | $9,477 | $2.64 | 1.70% | 35.70% | 4.80% | 5.60% | 5.70% | 13.90% | 4.8% |
| ALB | Albemarle | $172.03 | $19,969 | $1.56 | 0.90% | 45.90% | 1.30% | 5.20% | 5.00% | 9.00% | 1.3% |
| AMP | Ameriprise Financial | $250.99 | $29,009 | $4.52 | 1.80% | – | 8.70% | 7.90% | 8.50% | 17.30% | 7.9% |
| AOS | A.O. Smith | $72.10 | $11,493 | $1.04 | 1.40% | 41.50% | 8.30% | 13.00% | 16.70% | 22.20% | 8.3% |
| APD | Air Products & Chemicals | $288.80 | $63,717 | $6.00 | 2.10% | 64.70% | 11.90% | 10.90% | 11.80% | 10.00% | 10.0% |
| ATO | Atmos Energy | $96.98 | $12,712 | $2.50 | 2.60% | 43.90% | 8.70% | 8.80% | 8.30% | 6.30% | 6.3% |
| BDX | Becton, Dickinson | $246.77 | $72,857 | $3.32 | 1.40% | 57.40% | 5.10% | 3.40% | 4.70% | 7.30% | 3.4% |
| BEN | Franklin Resources | $32.26 | $16,232 | $1.12 | 3.50% | 51.20% | 3.70% | 6.80% | 9.20% | 12.90% | 3.7% |
| BF.B | Brown-Forman | $74.54 | $35,864 | $0.72 | 1.00% | 37.40% | 3.00% | 4.30% | 5.70% | 7.70% | 3.0% |
| BLK | BlackRock | $879.23 | $134,511 | $16.52 | 1.90% | 43.20% | 13.80% | 12.80% | 12.50% | 11.60% | 11.6% |
| BR | Broadridge Financial Soln | $162.93 | $18,981 | $2.30 | 1.40% | 50.60% | 6.50% | 16.40% | 13.90% | 14.40% | 6.5% |
| CE | Celanese | $153.14 | $16,733 | $2.72 | 1.80% | 14.20% | 9.70% | 8.00% | 13.60% | 29.80% | 8.0% |
| CHD | Church & Dwight Co | $84.90 | $20,752 | $1.01 | 1.20% | 31.00% | 5.20% | 5.10% | 7.30% | 19.50% | 5.1% |
| CHRW | C.H. Robinson Worldwide | $94.21 | $12,712 | $2.04 | 2.20% | 45.80% | 0.00% | 3.50% | 3.50% | 5.80% | 0.0% |
| CINF | Cincinnati Financial | $117.92 | $18,954 | $2.52 | 2.10% | 12.80% | 5.00% | 5.90% | 5.60% | 4.60% | 4.6% |
| CL | Colgate-Palmolive | $81.74 | $69,063 | $1.80 | 2.20% | 56.40% | 2.30% | 2.30% | 2.90% | 4.50% | 2.3% |
| CLX | Clorox | $178.85 | $22,180 | $4.64 | 2.60% | 60.10% | 4.70% | 5.00% | 7.60% | 7.30% | 4.7% |
| CMA | Comerica | $72.18 | $10,031 | $2.72 | 3.80% | 44.10% | 0.00% | 26.00% | 25.30% | 21.10% | 0.0% |
| CMI | Cummins | $242.13 | $34,789 | $5.40 | 2.20% | 41.70% | 3.00% | 7.70% | 6.70% | 17.80% | 3.0% |
| CMS | CMS Energy | $60.07 | $17,319 | $1.74 | 2.90% | 55.30% | 6.70% | 6.80% | 7.00% | 7.60% | 6.7% |
| COST | Costco Wholesale | $394.53 | $175,813 | $3.16 | 0.80% | 27.10% | 12.90% | 11.50% | 11.90% | 12.70% | 11.5% |
| CSX | CSX | $32.28 | $24,052 | $0.37 | 1.20% | 29.90% | 7.70% | 8.40% | 9.20% | 21.50% | 7.7% |
| CVX | Chevron | $106.21 | $202,863 | $5.36 | 5.10% | – | 3.90% | 6.20% | 4.60% | 5.60% | 3.9% |
| DLR | Digital Realty Trust | $149.84 | $42,739 | $4.64 | 3.10% | 318.30% | 3.60% | 4.70% | 5.70% | 5.50% | 3.6% |
| DOV | Dover | $150.96 | $21,529 | $1.98 | 1.30% | 38.40% | 1.00% | 1.70% | 3.30% | 6.10% | 1.0% |
| DTE | DTE Energy | $111.88 | $21,655 | $3.30 | 3.00% | 56.90% | 7.20% | 7.10% | 8.20% | 6.30% | 6.3% |
| DUK | Duke Energy | $99.55 | $76,109 | $3.86 | 3.90% | 222.00% | 2.10% | 2.70% | 3.20% | 2.80% | 2.1% |
| ECL | Ecolab | $209.18 | $60,427 | $1.92 | 0.90% | – | 2.10% | 5.40% | 6.50% | 10.60% | 2.1% |
| ED | Consolidated Edison | $72.54 | $25,728 | $3.10 | 4.30% | 90.60% | 1.30% | 2.70% | 3.00% | 2.60% | 1.3% |
| EIX | Edison | $57.91 | $21,820 | $2.65 | 4.60% | 120.40% | 3.90% | 3.10% | 6.70% | 7.50% | 3.1% |
| EMN | Eastman Chemical | $116.92 | $15,850 | $2.76 | 2.40% | 74.20% | 4.50% | 7.20% | 8.40% | 11.40% | 4.5% |
| EMR | Emerson Electric | $96.92 | $57,186 | $2.02 | 2.10% | 56.50% | 1.00% | 1.40% | 1.20% | 3.90% | 1.0% |
| ESS | Essex Property Trust | $303.93 | $19,894 | $8.36 | 2.80% | 127.80% | 0.60% | 4.00% | 5.50% | 7.20% | 0.6% |
| ETN | Eaton Corp | $150.17 | $59,160 | $3.04 | 2.00% | 82.20% | 4.10% | 4.80% | 5.90% | 8.40% | 4.1% |
| EVRG | Evergy | $61.39 | $14,122 | $2.14 | 3.50% | 64.00% | 5.90% | 10.20% | 7.10% | 5.30% | 5.3% |
| EXPD | Expeditors International | $127.28 | $21,413 | $1.16 | 0.90% | 20.40% | 11.50% | 8.80% | 7.70% | 8.80% | 7.7% |
| EXR | Extra Space Storage | $164.91 | $22,161 | $4.00 | 2.40% | 83.90% | 11.10% | 5.20% | 5.10% | 21.70% | 5.1% |
| FAST | Fastenal | $52.06 | $29,773 | $1.12 | 2.20% | 67.80% | 12.00% | 14.80% | 13.30% | 13.20% | 12.0% |
| FRT | Federal Realty Investment | $118.08 | $9,221 | $4.24 | 3.60% | 278.30% | 1.00% | 2.00% | 2.40% | 4.70% | 1.0% |
| GPC | Genuine Parts | $128.31 | $18,688 | $3.26 | 2.50% | 860.80% | 3.20% | 4.20% | 4.40% | 6.10% | 3.2% |
| GWW | W.W. Grainger | $444.84 | $23,725 | $6.48 | 1.50% | 42.50% | 12.50% | 6.00% | 5.80% | 9.40% | 5.8% |
| HD | Home Depot | $321.54 | $342,972 | $6.60 | 2.10% | 44.70% | 10.00% | 17.00% | 19.00% | 20.80% | 10.0% |
| HRL | Hormel Foods | $47.57 | $25,672 | $0.98 | 2.10% | 58.20% | 5.40% | 9.30% | 11.10% | 14.40% | 5.4% |
| HSY | Hershey | $173.70 | $35,504 | $3.22 | 1.90% | 46.00% | 4.00% | 7.00% | 6.60% | 8.80% | 4.0% |
| IBM | IBM | $146.84 | $130,274 | $6.56 | 4.50% | 108.10% | 0.60% | 1.50% | 3.20% | 8.10% | 0.6% |
| IEX | IDEX | $219.87 | $16,734 | $2.16 | 1.00% | 39.10% | 8.00% | 7.90% | 9.70% | 12.30% | 7.9% |
| IFF | Intl Flavors & Fragrances | $149.39 | $37,024 | $3.08 | 2.10% | 162.80% | 2.70% | 3.70% | 6.60% | 11.00% | 2.7% |
| IP | International Paper | $61.48 | $23,839 | $2.05 | 3.30% | 82.70% | 0.00% | 2.60% | 3.10% | 6.90% | 0.0% |
| ITW | Illinois Tool Works | $224.61 | $70,771 | $4.56 | 2.00% | 64.10% | 6.50% | 13.50% | 15.70% | 12.90% | 6.5% |
| JKHY | Jack Henry & Associates | $164.51 | $12,354 | $1.84 | 1.10% | 45.00% | 7.00% | 7.50% | 10.40% | 15.90% | 7.0% |
| JNJ | Johnson & Johnson | $165.96 | $435,154 | $4.24 | 2.60% | 70.40% | 5.00% | 5.60% | 5.80% | 6.40% | 5.0% |
| K | Kellogg | $63.97 | $21,645 | $2.32 | 3.60% | 61.50% | 1.80% | 2.40% | 3.00% | 3.70% | 1.8% |
| KLAC | KLA | $311.74 | $47,929 | $3.60 | 1.20% | 29.60% | 5.90% | 6.30% | 11.60% | 13.70% | 5.9% |
| KMB | Kimberly-Clark | $133.52 | $45,028 | $4.56 | 3.40% | 64.90% | 6.50% | 4.50% | 4.40% | 5.00% | 4.4% |
| KO | Coca-Cola | $53.96 | $231,583 | $1.68 | 3.10% | 98.80% | 2.40% | 2.50% | 3.70% | 6.00% | 2.4% |
| KR | Kroger | $38.13 | $28,893 | $0.84 | 2.20% | 35.70% | 12.50% | 12.90% | 11.40% | 13.10% | 11.4% |
| LEG | Leggett & Platt | $51.74 | $6,818 | $1.68 | 3.30% | 75.10% | 5.00% | 3.40% | 4.30% | 4.50% | 3.4% |
| LHX | L3Harris Technologies | $218.66 | $44,665 | $4.08 | 1.90% | 55.00% | 20.00% | 21.40% | 15.30% | 15.10% | 15.1% |
| LIN | Linde | $290.84 | $152,444 | $4.24 | 1.50% | 71.20% | 10.10% | 8.70% | 7.20% | 7.80% | 7.2% |
| LMT | Lockheed Martin | $380.22 | $104,299 | $10.40 | 2.70% | 40.20% | 8.30% | 9.10% | 9.50% | 13.20% | 8.3% |
| LNT | Alliant Energy | $56.27 | $14,069 | $1.61 | 2.90% | 63.00% | 5.90% | 6.30% | 6.50% | 6.60% | 5.9% |
| LOW | Lowe’s Companies | $195.82 | $138,587 | $3.20 | 1.60% | 25.50% | 9.10% | 13.50% | 16.50% | 18.50% | 9.1% |
| MCD | McDonald’s | $232.27 | $172,849 | $5.16 | 2.20% | 73.40% | 3.20% | 8.50% | 7.70% | 7.80% | 3.2% |
| MCK | McKesson | $192.67 | $30,566 | $1.68 | 0.90% | – | 2.40% | 7.30% | 8.40% | 7.70% | 2.4% |
| MCO | Moody’s | $365.31 | $69,134 | $2.48 | 0.70% | 21.30% | 10.70% | 12.10% | 10.90% | 16.00% | 10.7% |
| MKC | McCormick & Co | $87.97 | $23,298 | $1.36 | 1.60% | 44.30% | 9.70% | 9.40% | 9.60% | 9.30% | 9.3% |
| MKTX | MarketAxess Holdings | $464.21 | $17,957 | $2.64 | 0.60% | 30.20% | 10.00% | 16.30% | 20.50% | 22.00% | 10.0% |
| MMC | Marsh & McLennan | $142.34 | $72,517 | $1.86 | 1.30% | 42.10% | 2.20% | 7.40% | 8.40% | 8.30% | 2.2% |
| MMM | 3M | $199.09 | $113,896 | $5.92 | 3.00% | 59.80% | 0.70% | 2.90% | 5.90% | 10.40% | 0.7% |
| MO | Altria Group | $47.83 | $86,844 | $3.44 | 7.20% | 146.20% | 2.40% | 7.10% | 8.80% | 8.50% | 2.4% |
| MSFT | Microsoft | $271.60 | $2,049,350 | $2.24 | 0.80% | 28.90% | 9.80% | 10.10% | 9.20% | 13.30% | 9.2% |
| NEE | NextEra Energy | $74.19 | $147,885 | $1.54 | 2.10% | 67.40% | 10.00% | 11.50% | 12.10% | 10.80% | 10.0% |
| NKE | Nike | $158.00 | $251,993 | $1.10 | 0.70% | 47.70% | 12.20% | 11.20% | 11.40% | 13.50% | 11.2% |
| NOC | Northrop Grumman | $367.62 | $58,663 | $6.28 | 1.70% | 21.20% | 8.30% | 9.40% | 11.80% | 12.10% | 8.3% |
| NUE | Nucor | $96.65 | $28,529 | $1.62 | 1.70% | 29.90% | 0.60% | 2.10% | 1.60% | 1.10% | 0.6% |
| O | Realty Income | $67.05 | $25,605 | $2.83 | 4.20% | 289.40% | 0.90% | 2.30% | 3.40% | 5.00% | 0.9% |
| OKE | ONEOK | $56.93 | $25,154 | $3.74 | 6.60% | 142.20% | 0.00% | 5.60% | 8.70% | 13.70% | 0.0% |
| PBCT | People’s United Finl | $17.40 | $7,374 | $0.73 | 4.20% | 135.90% | 1.40% | 1.40% | 1.40% | 1.50% | 1.4% |
| PEP | PepsiCo | $148.20 | $204,541 | $4.30 | 2.90% | 75.50% | 5.10% | 5.00% | 7.40% | 7.60% | 5.0% |
| PFG | Principal Financial Gr | $63.54 | $17,380 | $2.44 | 3.80% | 37.80% | 8.90% | 5.50% | 9.40% | 13.30% | 5.5% |
| PG | Procter & Gamble | $135.24 | $329,798 | $3.48 | 2.60% | 56.20% | 10.00% | 6.60% | 5.40% | 5.20% | 5.2% |
| PM | Philip Morris Intl | $99.89 | $153,844 | $4.80 | 4.80% | 86.10% | 2.60% | 1.70% | 3.30% | 6.50% | 1.7% |
| PPG | PPG Industries | $169.99 | $40,015 | $2.16 | 1.30% | 42.40% | 5.90% | 6.30% | 6.20% | 6.60% | 5.9% |
| PRGO | Perrigo | $46.71 | $6,312 | $0.96 | 2.10% | – | 6.70% | 8.10% | 10.60% | 13.10% | 6.7% |
| PRU | Prudential Financial | $103.30 | $40,405 | $4.60 | 4.50% | 66.20% | 4.50% | 8.50% | 10.40% | 12.20% | 4.5% |
| QCOM | Qualcomm | $140.80 | $159,286 | $2.72 | 1.90% | 36.70% | 4.60% | 3.10% | 5.10% | 12.20% | 3.1% |
| RHI | Robert Half International | $89.36 | $10,015 | $1.52 | 1.70% | 48.00% | 11.80% | 10.70% | 11.60% | 10.50% | 10.5% |
| ROK | Rockwell Automation | $285.30 | $32,834 | $4.28 | 1.50% | 30.60% | 4.90% | 5.20% | 8.10% | 11.80% | 4.9% |
| RSG | Republic Services | $110.61 | $35,045 | $1.70 | 1.50% | 52.70% | 4.90% | 7.20% | 7.20% | 7.80% | 4.9% |
| SHW | Sherwin-Williams | $275.34 | $73,314 | $2.20 | 0.80% | 24.10% | 23.10% | 24.30% | 14.50% | 16.30% | 14.5% |
| SJM | JM Smucker | $130.05 | $14,151 | $3.60 | 2.80% | 46.00% | 2.30% | 4.90% | 6.10% | 7.40% | 2.3% |
| SNA | Snap-on | $223.42 | $11,862 | $4.92 | 2.20% | 36.70% | 13.90% | 14.50% | 15.10% | 14.40% | 13.9% |
| SO | Southern | $61.48 | $65,030 | $2.64 | 4.30% | 80.00% | 3.10% | 3.20% | 3.30% | 3.40% | 3.1% |
| SPGI | S&P Global | $412.20 | $99,329 | $3.08 | 0.80% | 27.20% | 14.90% | 15.50% | 16.40% | 11.90% | 11.9% |
| STE | Steris | $208.95 | $20,843 | $1.60 | 0.80% | 33.70% | 8.10% | 8.90% | 9.90% | 10.30% | 8.1% |
| SWK | Stanley Black & Decker | $206.44 | $33,240 | $2.80 | 1.40% | 27.90% | 1.40% | 3.60% | 4.90% | 5.50% | 1.4% |
| SYK | Stryker | $262.70 | $99,242 | $2.52 | 1.00% | 64.40% | 9.60% | 10.30% | 10.60% | 13.30% | 9.6% |
| T | AT&T | $29.11 | $206,978 | $2.08 | 7.20% | – | 0.00% | 1.30% | 1.60% | 1.90% | 0.0% |
| TGT | Target | $243.47 | $120,504 | $3.60 | 1.50% | 21.90% | 3.00% | 3.10% | 4.00% | 10.50% | 3.0% |
| TROW | T. Rowe Price Gr | $199.94 | $45,315 | $4.32 | 2.20% | 31.90% | 20.00% | 15.60% | 14.90% | 13.30% | 13.3% |
| TRV | Travelers Companies | $151.83 | $38,131 | $3.52 | 2.30% | 30.60% | 3.50% | 4.60% | 5.60% | 7.90% | 3.5% |
| TXN | Texas Instruments | $190.84 | $176,777 | $4.08 | 2.10% | 57.40% | 13.30% | 18.10% | 21.80% | 22.90% | 13.3% |
| UNH | UnitedHealth Group | $404.89 | $379,862 | $5.80 | 1.40% | 28.10% | 16.00% | 17.20% | 18.30% | 24.50% | 16.0% |
| UNM | Unum | $28.83 | $5,842 | $1.20 | 4.20% | 29.60% | 0.00% | 7.40% | 9.00% | 11.90% | 0.0% |
| UNP | Union Pacific | $223.55 | $147,640 | $4.28 | 1.90% | 50.00% | 10.30% | 13.60% | 14.20% | 16.20% | 10.3% |
| UPS | United Parcel Service | $210.22 | $182,686 | $4.08 | 1.90% | 68.30% | 1.00% | 3.90% | 5.50% | 7.00% | 1.0% |
| V | Visa | $235.15 | $522,129 | $1.28 | 0.50% | 25.60% | 6.70% | 15.10% | 18.00% | 23.90% | 6.7% |
| VZ | Verizon Communications | $56.29 | $232,254 | $2.51 | 4.50% | 54.70% | 2.00% | 2.10% | 2.10% | 2.60% | 2.0% |
| WBA | Walgreens Boots Alliance | $48.71 | $41,607 | $1.87 | 3.80% | – | 2.20% | 5.30% | 5.40% | 10.30% | 2.2% |
| WM | Waste Management | $141.17 | $59,557 | $2.30 | 1.60% | 59.90% | 5.50% | 7.30% | 7.00% | 5.40% | 5.4% |
| WMT | Walmart | $139.32 | $380,096 | $2.20 | 1.60% | 50.40% | 1.90% | 1.90% | 1.90% | 4.20% | 1.9% |
| WRB | WR Berkley | $75.96 | $13,429 | $0.52 | 0.70% | 11.70% | 8.30% | 9.10% | 8.40% | 9.30% | 8.3% |
| WST | West Pharmaceutical Servs | $363.01 | $26,865 | $0.68 | 0.20% | 11.60% | 6.30% | 6.70% | 7.20% | 7.20% | 6.3% |
| XEL | Xcel Energy | $67.03 | $35,982 | $1.83 | 2.70% | 60.30% | 6.40% | 6.40% | 6.10% | 5.80% | 5.8% |
| XLNX | Xilinx | $141.81 | $33,645 | – | – | 43.00% | 2.70% | 3.00% | 4.40% | – | 2.7% |
| XOM | Exxon Mobil | $63.26 | $265,860 | $3.48 | 5.50% | – | 0.00% | 2.00% | 3.00% | 6.40% | 0.0% |
Step 2: Generate the stocks’ DPS growth rate over 1-year, 3-year, 5-year and 10-year
Next, I will look at their average DPS growth rate over the past 1-year, 3-year, 5-year, and 10-year.
For example, Home Depot (HD) is a stock that has consecutively grown its DPS for 11 years, so it fits the first criteria.
The stock has a 1-year DPS growth rate of 10%, a 3-year average DPS growth rate of 17%, a 5-year average DPS growth rate of 19%, and a 10-year average DPS growth rate of 21%.
Step 3: Use the lowest growth rate as the default DPS growth rate for the next 20 years
Next, I will use the lowest growth rate as my default DPS growth rate over the next 20 years. For HD, that will be a growth rate of 10%.
This is a major assumption used in the valuation process. Ideally, we will want to see the 1-year DPS growth rate being faster than the 3-year, 5-year, and 10-year rates.
To be conservative, I select the lowest growth rate from this list (although there is still a major risk that the DPS growth rate will taper even further ahead).
I assume that the company, HD in this example, will be able to grow its current DPS (which is $6.60/share by 10% (lowest rate) on average over the next 20 years.
Step 4: Find the current dividend yield.
The next major assumption is that HD’s yield, which currently stands at 2.1%, will be maintained over the next 20 years.
Step 5: Apply the dividend yield theory to find the fair value of the dividend growth stock for each year
Based on these assumptions and the application of the dividend yield theory, where a company’s fair value can be derived by dividing its DPS by its dividend yield, I can calculate that HD’s 1-year forward DPS is $7.26 and its fair value would be $346 in 2022.
Step 6: Calculate the number of shares purchased each year based on a $10k capital investment + dividends reinvested
Now assuming that I invest $10k in 2021 into HD at its current price of $322. I will have bought 31.1 shares (assuming fractional investing is possible) of HD and be entitled to a total dividend payment of $205.
I reinvest this dividend such that my 2022 capital would be $10k + $205 = $10,205 and based on the then assumed fair value of $346, I can purchase 29.52 HD shares, with a total cumulative share base of 60.62 shares over 2 years.
This amount of shares entitles me to a dividend payment of $440 in 2022 which is again reinvested in 2023 for a total investment amount of $10k + $440 = $10,440 to now purchase 27.45 shares based on the fair value of $380/share in 2023.
Step 7: Repeat the same process to derive total shares purchased over 20 years and the final fair value of the stock. Calculate the end portfolio value.
This continues over the next 17 years and by 2040, I would have accumulated 378.2 shares of HD. Assuming the dividend yield theory holds, the fair value of HD will be $1,922/share in 2040 (representing a CAGR of 9.34%).
My 378.2 shares would be worth approx. $726k in 20 years.
Best dividend growth stocks with the largest upside potential
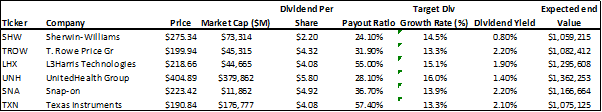
Among the list of 100+ strong dividend growers with a fantastic track record of growing their DPS every year, the one that has the highest upside potential based on this valuation methodology is UNH, turning a $10k annual investment into a $1.36m portfolio at the end of 20 years.
Other dividend growth stocks which will turn a $10k annual investment into a million-dollar portfolio after 20 years include dividend growers such as TROW, SHW, LHX, SNA, and TXN.
Do note that the major assumption in this analysis is the annual dividend growth rate. The higher the assumed growth rate used, the higher is the risk that our end goal will fall flat of a million-dollar portfolio.
Among these 6 stocks that can turn a $10k annual investment into a $1m portfolio after 20 years, UNH has the highest growth assumption rate at a 16% DPS growth rate while both TROW and TXN have the lowest growth rate at 13.3%.
The other major assumption is that the yield over the next 20 years will remain constant for these dividend stocks. For example, I assumed that UNH’s dividend yield will be maintained at 1.4% over the next 20 years.
If there is a yield compression where its average yield over the next 20 years is less than 1.4%, then the end portfolio value of UNH will be HIGHER than our assumed $1.36m target. If however, the average yield is higher than 1.4% (yield expansion), then the end portfolio value of UNH will be LOWER than our assumed $1.36m.
Many of the strong dividend growers in the list have also been a key beneficiary of a yield compression over the past decade, translating to strong appreciation seen in their prices. This is different from the dividend yield theory where one assumes that a stock’s dividend yield will revert to its long-term average (eg: revert to a 10-year average yield)
In the case of UNH, there is a lesser risk of a yield expansion, given that the counter’s yield has been approx. 1.3-1.7% over the past 10-years vs. assumption used of 1.4%.
Conclusion
While different investors will have different opinions of which might be the best dividend growth stocks in the US universe, evaluating the individual company’s fundamentals such as business outlook, etc, I have shown a simple method to derive the best dividend growth stock based on certain key assumptions and using the principles behind the dividend yield theory, albeit with some modifications.
There are of course other parameters such as payout ratio (all the 6 companies highlighted here have a payout ratio less than 60%) which looks at the sustainability of the dividend growth assumption as well as the company’s free cash flow generation profile etc that has not been thoroughly considered.
Nonetheless, the best dividend growth stocks highlighted in this list have all substantially outperformed the S&P500 since Jan 2007, with dividend-adjusted returns of 548% and 1495% over this horizon vs. the S&P 500 appreciation of 308%.
These dividend growth stocks are worthy of your consideration to dollar cost average consistently every year and before you know it you might find yourself becoming a millionaire. (assuming a $10k annual investment)
Do Like Me on Facebook if you enjoy reading the various investment and personal finance articles at New Academy of Finance. I do post interesting articles on FB from time to time which might not be covered here in this website.
Join our Instagram channel for more tidbits on all things finance!
SEE OUR OTHER WRITE-UPS
- How to double dividend yield using this simple strategy
- Top 5 Undervalued Small-Cap Singapore Dividend Stocks (>4% yield) (2021)
- Strong Dividend Growth Stocks Increasing Dividends by up to 19% in 2020
- 6 Blue-Chip Dividend Growth Stocks with High Dividend Growth Rate
- How to invest in Dividend stocks
- Dividend Investing Strategy: Combining key ratios with economic moats
Disclosure: The accuracy of the material found in this article cannot be guaranteed. Past performance is not an assurance of future results. This article is not to be construed as a recommendation to Buy or Sell any shares or derivative products and is solely for reference only


