
Table of Contents
Do Like Me on Facebook if you enjoy reading the various investment and personal finance articles at New Academy of Finance. I do post interesting articles on FB from time to time that might not be covered here in this website.
Join our Instagram channel for more tidbits on all things finance!
Join our Youtube channel for short and sweet videos on all things finance!
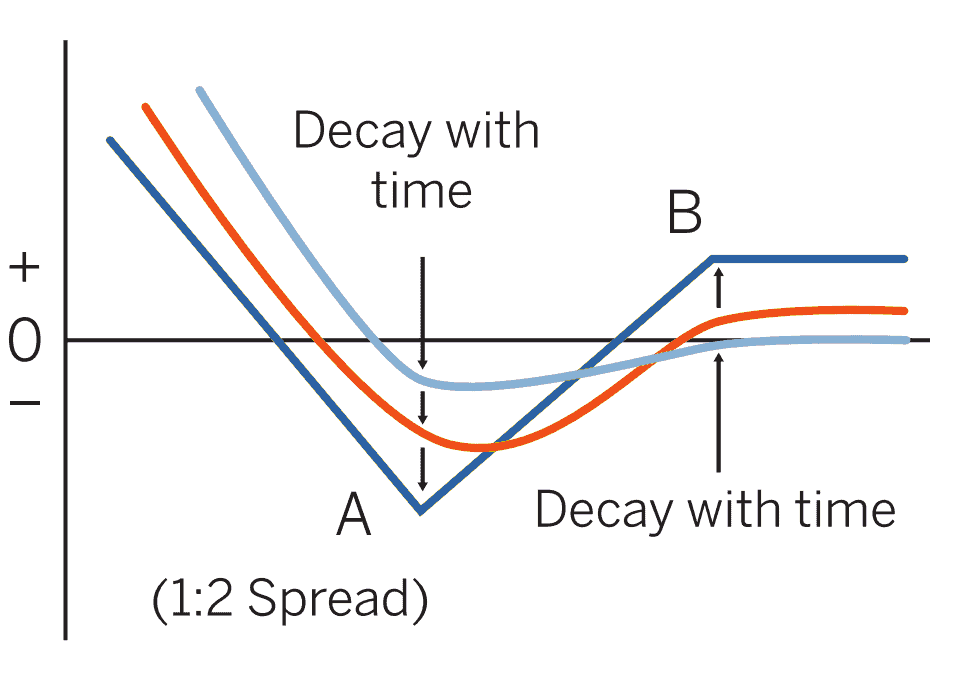
1×2 Put Ratio
Is there a hedging strategy that will allow you to win big in a market crash and lose nothing if the market continues to rally from here? Sounds too good to be true? Well, there is indeed a strategy that will allow you to hedge your portfolio with no upfront cost. What exactly is the catch over here?
What is this amazing hedging strategy?
This hedging strategy is known as the 1×2 put ratio. I assume here that my fellow NAOF readers will already be aware of what call and put options are as well as their basic functions. For those who are not familiar with options, you can check out the following reading resources.
Additional Reading: 4 Option Trading Strategies for Beginners
This is how the strategy works: You sell 1 ATM put option which will entitle you to receive a premium. You will use the premium received to purchase 2 further out-of-the-money put options.
Remember that the buyer of a put option stands to benefit when the underlying asset price drops below the strike price while the seller of the put option will experience an equivalent loss (excluding the premium received upfront).
Let’s use an example for further illustration.
A quick example of 1×2 put ratio for hedging
The current price of Stock ABC is trading at $100/share. Let’s assume that the premium of a put option with a strike of $100 is $5 and the premium of a put option with a strike of $95 is $2.50. In the 1×2 put ratio, you sell the more “expensive” ATM put option ($100 strike) and receive the $5 premium.
Concurrently, you also buy 2 of the cheaper put options ($95 strike) and pay 2x$2.50 = $5. So essentially, you are not paying a single cent to implement your portfolio hedging strategy. Put simply, if markets go up, you don’t lose anything. If markets crash big time, you stand to make big gains.
So, what is the catch over here?
Implementing a hedging strategy with no upfront cost does not mean ZERO downside risk. This is similar to structuring a bull put spread, one where you sell an ATM/OTM put option and concurrently, buying a further OTM put option. Such a structure will allow you to receive a premium upfront. That premium received is your maximum profit potential.
You will also be able to calculate your maximum risk level which is the difference between the 2 put strike prices minus the net premium received. You will still incur a loss if the price movement did not pan out according to your expectations (despite receiving a premium upfront)
The difference between a bull put spread and that of the 1×2 put ratio is that while your risk level is also defined, your max gain potential can be substantial.
Let’s use a few scenarios to illustrate both the risk and reward potential of this 1×2 Put ratio trade.
Additional Reading: 3 Safe Option Strategies better than stock buying
1×2 Put Ratio Scenario 1: Price continues to appreciate
In the scenario that the share price continues to appreciate from the $100/share level, your 1 Sell Put contract and 2 Buy Put contracts will all expire worthless.
Your portfolio continues to benefit from the rise in share prices and you don’t get to lose anything from your 1×2 Put Ratio hedge.
1×2 Put Ratio Scenario 2: Price falls substantially
If the price of the underlying falls substantially, let say to $80/share (from the original level of $100/share), this is where all your put options are now In-the-money (ITM). What is going to happen?
The $100 put strike which you have sold 1 contract will now be losing you money. This trade will now have a loss of $20/share or $2,000/put contract (since each option contract consist of 100 shares)
However, your $95 put strikes where you have bought 2 contracts will now be profitable. The profit potential will be $95-$80=$15/share or $1,500/put contract. $1,500*2= $3,000
Overall profit potential = $3,000 – $2,000 = $1,000
The lower the price of the underlying falls, the greater will be the profit potential of this trade.
If the price dips to $50 for example, your loss on your 1 sell put contract will be $5,000 but this will be more than fully compensated by the profits on your 2 buy put contracts, which will amount to $9,000, thus your net profit will be $4,000.
Do note that you have achieved this hedging profit without a single upfront cost.
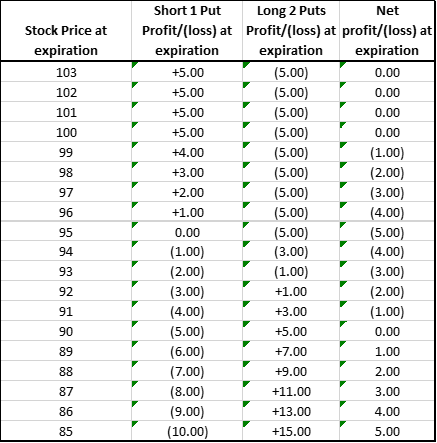
1×2 Put Ratio Scenario 3: Price falls marginally
This is the scenario that we wish to avoid. What happens when the share price dips marginally from $100/share to $95/share on contract expiration?
Your 1 sell put contract will now be incurring a loss of $500 while your 2 buy put option contracts will expire worthless.
This is where you will realize your maximum loss potential of $500.
Between the price of $95 to $100, your 2 buy put contracts will be worthless while you will incur a varying degree of losses from your 1 sell put contract (max loss at $95, reducing to $0 losses at $100) which is now ITM.
Your breakeven price from the trade is $90 on expiration, as shown in the table below.
Additional Reading: Hedging with options: How to hedge using puts
Difference between a 1×2 Put ratio vs. a normal put purchase for hedging
For hedging purposes, a simple way would be to purchase a put option on the underlying, say for example the QQQ ETF if one wishes to have some portfolio protection (where the portfolio is heavily skewed towards the ownership of big-tech counters).
Unlike the purchase of a put option which will necessitate an upfront cost, there is no initial cost associated with the 1×2 put ratio strategy.
However, the downside of the 1×2 put ratio vs. a simple buy put is that the loss potential of the former could be higher in certain cases. Similarly, the profit potential of the 1×2 put ratio might also be lower than that of a simple put purchase.
The table below illustrates the profit potential of the 1×2 Put ratio vs. 1 Long Put trade
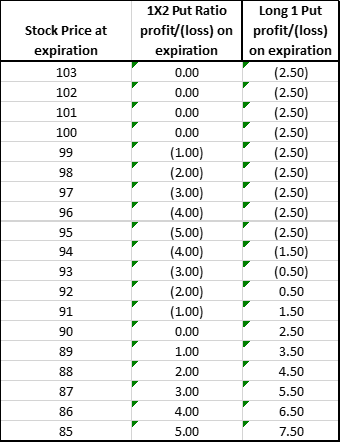
The benefit of the 1×2 Put ratio structure is that there are no losses if prices remain stagnant at $100/share or appreciate further (since the cost of the 2 long puts is fully offset by the premium received from the 1 short put). However, in the case of a 1 long put structure, there is a net debit outlay.
The losses for the 1×2 Put ratio is $500 (incurred at $95) whereas that of the Long Put is $250 (incurred when the price is at $95 and above)
The breakeven of the 1×2 Put ratio is at $90 whereas that of the Long put is $92.50.
The profit potential of the 1 Long Put will be larger than the 1×2 Put ratio structure when prices decline.
In an environment where volatility is high, going long on a put option contract might be inherently expensive. In this case, the 1×2 Put ratio structure will be more advantageous due to the sell leg (at strike $100) benefitting from the high implied volatility of the options contracts.
How to structure the 1×2 Put ratio
I have shown how the 1×2 Put ratio can be a method to hedge your portfolio with no upfront cost. You could even generate a net credit from this trade if the premium received from selling 1 put option contract > offset the cost of purchasing 2 further OTM put options.
In addition, your profit potential is not being capped in the event of a significant drawdown in share prices of the underlying. This is unique as typically when one structures a credit trade (receive premium) his/her maximum profit potential is capped.
One can do this by purchasing a lower strike Put (ie instead of buying 2 put contracts at a strike of $95, the strike of $90 is selected instead). This will entail a lower premium cost for the 2 long put contracts. However, do note that such a structure might result in higher losses (difference between the long and short strike prices which is now at $10/share vs. original at $5/share)
When selling and buying the put option contracts, do note that the expiration of these put options should be the same and a mismatch could lead to some nasty surprises.
When it comes to the duration of the 1×2 put ratio structure, longer-term options will be more beneficial vs. shorter-term ones as there is no need to constantly rebalance. In addition, if one’s strike prices between their buy and sell contracts are wider, more time is thus required for the trade to move sufficiently in one’s direction to achieve breakeven and subsequent profitability.
However, do note that rebalancing is required (even in a long-duration contract) if the price of the underlying increase significantly. This is to avoid a situation where prices go up significantly before crashing down below the original prices, leaving you with a loss.
Rebalancing can be done by shifting both the buy and sell strike prices higher (ie from 95/100 to 115/120 respectively in the event share price appreciates significantly from $100 to $120). Such a rebalancing might or might not entail a small cost.
Lastly, one needs to be aware that early assignment on your sell put trade might happen. This is a scenario that typically happens when the share price has collapsed significantly and the buyer of the put contract exercises his/her right to sell to you his shares of the underlying and you have to take ownership of actual stocks.
This could mean taking a long position of the underlying that will require more margin. However, there is no additional profit/loss impact from the conversion of the short put into actual shares. Whatever losses incurred from the stock ownership will be fully mitigated by your long put contracts.
Conclusion
The 1×2 put ratio is an alternate method to hedge your portfolio without any form of upfront cost. However, that does not mean you will not incur any losses.
If prices decline substantially below the breakeven level, you get to benefit from exponential gains. If prices continue to rally, your portfolio benefits while your hedge is free.
Of course, the worst-case scenario is that there is only a marginal decline in the underlying price.
You could also tailor the 1×2 put ratio strategy into a net credit trade, one where you are being paid to hedge your portfolio. This can be done by purchasing further OTM put options (lower premium cost) or selling ATM put options (higher premium received) or both. However, do note that you could be increasing your maximum loss potential in this scenario.
If you are more risk-averse, you can also limit your maximum losses by selecting strike prices that are closer to each other.
One can also execute this 1×2 put ratio strategy, not just as a hedge but also as a way to bet on the negative earnings announcement. If earnings are terrible and prices plunge, you get to benefit significantly from the price drop. On the other hand, if news flow is positive and price appreciates, you get to preserve your capital. Avoid stocks that tend to have minimal movements post earnings for such a strategy.
SEE OUR OTHER WRITE-UPS
- The Wheel Strategy Options: Does this option strategy makes sense?
- Covered Call Strategy: Making money when the markets don’t do much
- Cash Secured Put: Generating passive income the right way
- How to double dividend yield using this simple strategy
- Selling Put Options: Sell Puts to win in any market scenario
- Hedging with options: How to hedge using puts


